
Compare Stanley Lifesty. with Similar Stocks
Dashboard
Weak Long Term Fundamental Strength with a -28.68% CAGR growth in Operating Profits over the last 5 years
- Company's ability to service its debt is weak with a poor EBIT to Interest (avg) ratio of 1.81
- The company has been able to generate a Return on Equity (avg) of 4.79% signifying low profitability per unit of shareholders funds
The company has declared Negative results for the last 3 consecutive quarters
Falling Participation by Institutional Investors
Stock DNA
Furniture, Home Furnishing
INR 796 Cr (Micro Cap)
53.00
32
0.00%
0.27
3.30%
1.68
Total Returns (Price + Dividend) 
Stanley Lifesty. for the last several years.
Risk Adjusted Returns v/s
Returns Beta

News

Stanley Lifestyles Ltd is Rated Strong Sell
Stanley Lifestyles Ltd is rated Strong Sell by MarketsMOJO, with this rating last updated on 01 July 2025. However, the analysis and financial metrics discussed here reflect the company’s current position as of 04 June 2026, providing investors with the latest insights into its performance and outlook.
Read full news article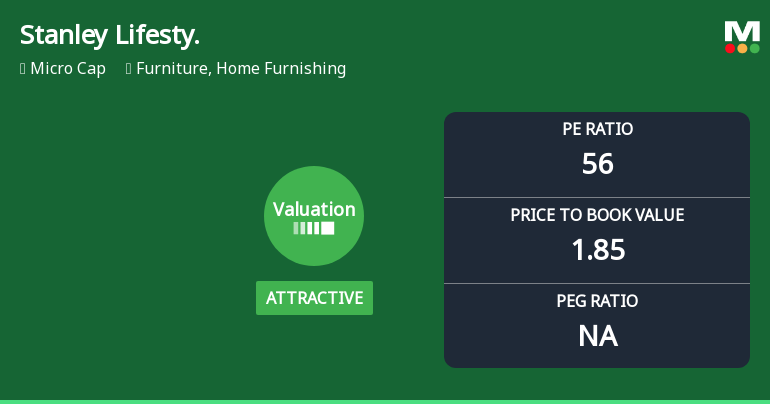
Stanley Lifestyles Ltd Valuation Shifts Amid Market Pressure
Stanley Lifestyles Ltd, a micro-cap player in the Furniture and Home Furnishing sector, has witnessed a notable shift in its valuation parameters, moving from a very attractive to an attractive price level. Despite this improvement, the company continues to face significant headwinds, reflected in its recent share price decline and subdued financial metrics compared to peers and broader market benchmarks.
Read full news article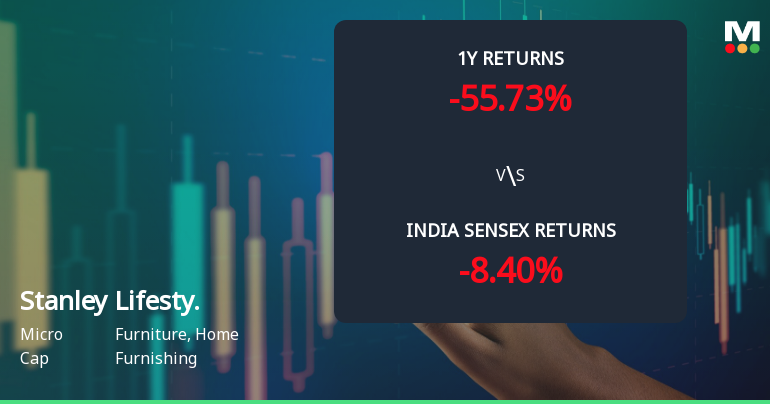
Stanley Lifestyles Ltd Faces Technical Setbacks Amid Bearish Momentum
Stanley Lifestyles Ltd, a micro-cap player in the furniture and home furnishing sector, has experienced a notable shift in its technical momentum, signalling increased bearish pressure. The stock’s recent price action, combined with mixed technical indicators, paints a challenging outlook for investors amid a broader market environment that has seen the Sensex outperform this stock significantly over the past year.
Read full news article Announcements
Announcement under Regulation 30 (LODR)-Award_of_Order_Receipt_of_Order
10-Jun-2026 | Source : BSEStanley Lifestyles Limited - Intimation of Award of Order.
Board Meeting Outcome for Stanley Lifestyles Limited Has Informed The Exchange Regarding Outcome Of Board Meeting Held On June 09 2026.
09-Jun-2026 | Source : BSEIntimation of the Outcome of the Meeting of Board of Directors held on 09th June 2026 for Approval of Scheme of Amalgamation and disclosure under Regulation 30 of SEBI (Listing Obligations and Disclosure Requirements) Regulations 2015.
Announcement under Regulation 30 (LODR)-Press Release / Media Release
08-Jun-2026 | Source : BSEPress Release on Elevation of Mr. Venkataramana Gorti as Managing Director of the Company
Corporate Actions

No Upcoming Board Meetings

No Dividend history available

No Splits history available

No Bonus history available

No Rights history available
Quality key factors
Valuation key factors
Technicals key factors
 Technical Indicator Scale: Bearish, Mildly Bearish, Sideways, Mildly Bullish, Bullish Turned
 Shareholding Snapshot : Mar 2026
Shareholding Compare (%holding)
Promoters
None
Held by 5 Schemes (15.04%)
Held by 8 FIIs (3.59%)
Sunil Suresh (28.35%)
Nippon Life India Trustee Ltd-a/c Nippon India Val (8.28%)
20.43%
Quarterly Results Snapshot (Consolidated) - Mar'26 - QoQ

QoQ Growth in quarter ended Mar 2026 is -2.31% vs -1.52% in Dec 2025

QoQ Growth in quarter ended Mar 2026 is -33.33% vs -110.71% in Dec 2025
Half Yearly Results Snapshot (Consolidated) - Sep'25
Growth in half year ended Sep 2025 is 5.11% vs -1.12% in Sep 2024
Growth in half year ended Sep 2025 is 35.00% vs -18.03% in Sep 2024
Nine Monthly Results Snapshot (Consolidated) - Dec'25
YoY Growth in nine months ended Dec 2025 is 1.44% vs 0.03% in Dec 2024
YoY Growth in nine months ended Dec 2025 is -30.65% vs -2.62% in Dec 2024
Annual Results Snapshot (Consolidated) - Mar'26
YoY Growth in year ended Mar 2026 is -1.62% vs -1.46% in Mar 2025
YoY Growth in year ended Mar 2026 is -58.42% vs -3.32% in Mar 2025
About Stanley Lifestyles Ltd

Company Coordinates


