
Compare Star Bulk Carriers Corp. with Similar Stocks
Total Returns (Price + Dividend) 
TimePeriod
Price Return
Dividend Return
Total Return
3 Months
46.73%
0%
46.73%
6 Months
43.72%
0%
43.72%
1 Year
-8.29%
0%
-8.29%
2 Years
27.54%
0%
27.54%
3 Years
-14.28%
0%
-14.28%
4 Years
7.34%
0%
7.34%
5 Years
248.57%
0%
248.57%
Star Bulk Carriers Corp. for the last several years.
Risk Adjusted Returns v/s
News
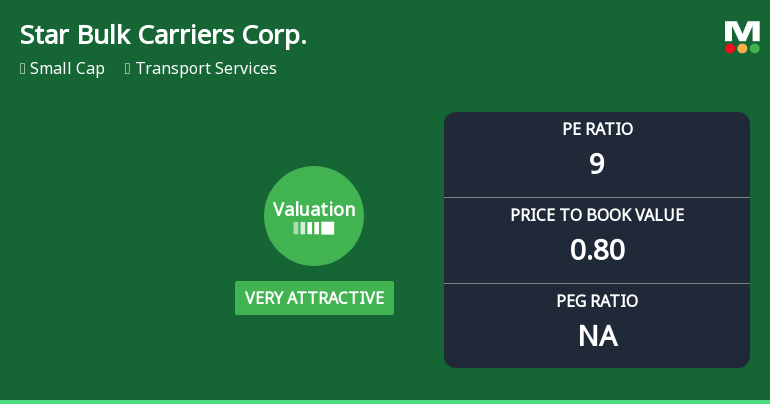
Star Bulk Carriers Corp. Experiences Revision in Its Stock Evaluation Amid Competitive Market Landscape
Star Bulk Carriers Corp. has recently adjusted its valuation, showcasing a P/E ratio of 9 and a price-to-book value of 0.80. The company features a high dividend yield of 712.62% and competitive returns on capital and equity, while outperforming the S&P 500 year-to-date.
Read full news article Announcements

No announcement available
Corporate Actions
No corporate action available
Quality key factors
Factor
Value
Sales Growth (5y)
7.08%
EBIT Growth (5y)
22.66%
EBIT to Interest (avg)
6.13
Debt to EBITDA (avg)
2.38
Net Debt to Equity (avg)
0.34
Sales to Capital Employed (avg)
0.33
Tax Ratio
0
Dividend Payout Ratio
89.20%
Pledged Shares
0
Institutional Holding
43.21%
ROCE (avg)
13.11%
ROE (avg)
17.22%
Valuation key factors
Factor
Value
P/E Ratio
9
Industry P/E
Price to Book Value
0.80
EV to EBIT
10.90
EV to EBITDA
6.46
EV to Capital Employed
0.85
EV to Sales
2.25
PEG Ratio
NA
Dividend Yield
712.62%
ROCE (Latest)
7.78%
ROE (Latest)
9.23%
Technicals key factors
Indicator
Weekly
Monthly
MACD
Bullish
Bullish
RSI
No Signal
Bearish
Bollinger Bands
Bullish
Bullish
Moving Averages
Bullish (Daily)
KST
Bullish
Mildly Bullish
Dow Theory
Mildly Bullish
Mildly Bullish
OBV
No Trend
No Trend
 Technical Indicator Scale: Bearish, Mildly Bearish, Sideways, Mildly Bullish, Bullish Turned
 Shareholding Snapshot : Sep 2025
Shareholding Compare (%holding)
Majority shareholders
Domestic Funds
Domestic Funds
Held in 36 Schemes (9.77%)
Foreign Institutions
Held by 89 Foreign Institutions (7.91%)
Strategic Entities with highest holding
Highest Public shareholder
Quarterly Results Snapshot (Consolidated) - Jun'25 - QoQ
Jun'25
Mar'25
Change(%)
Net Sales
247.40
230.70
7.24%
Operating Profit (PBDIT) excl Other Income
61.10
45.00
35.78%
Interest
18.90
19.80
-4.55%
Exceptional Items
1.30
2.60
-50.00%
Consolidate Net Profit
0.00
0.50
-100.00%
Operating Profit Margin (Excl OI)
74.90%
8.70%
6.62%
USD in Million.

Net Sales
QoQ Growth in quarter ended Jun 2025 is 7.24% vs -25.32% in Mar 2025

Consolidated Net Profit
QoQ Growth in quarter ended Jun 2025 is -100.00% vs -98.82% in Mar 2025
Annual Results Snapshot (Consolidated) - Dec'24
Dec'24
Dec'23
Change(%)
Net Sales
1,265.50
949.30
33.31%
Operating Profit (PBDIT) excl Other Income
507.20
333.60
52.04%
Interest
97.40
93.10
4.62%
Exceptional Items
6.40
16.40
-60.98%
Consolidate Net Profit
304.70
173.60
75.52%
Operating Profit Margin (Excl OI)
271.10%
205.60%
6.55%
USD in Million.
Net Sales
YoY Growth in year ended Dec 2024 is 33.31% vs -33.95% in Dec 2023
Consolidated Net Profit
YoY Growth in year ended Dec 2024 is 75.52% vs -69.33% in Dec 2023
About Star Bulk Carriers Corp.

Star Bulk Carriers Corp.
Transport Services
Star Bulk Carriers Corp is a Greece-based shipping company. It owns and operates a fleet of dry bulk carrier vessels. The Company’s vessels transport major bulks, which include iron ore, coal and grain, and minor bulks, which include bauxite, fertilizers and steel products. Its fleet composition ranges from Supramax vessels to Newcastlemax vessels that carry a total capacity of more than 12 million deadweight tonnage (dwt). Star Bulk Carriers Corp’s Capesize vessels, primarily transport minerals from the Americas and Australia to East Asia, particularly China, but also Japan, South Korea, Taiwan, Indonesia and Malaysia. The Company’s Supramax vessels carry minerals, grain products and steel between the Americas, Europe, Africa, Australia and Indonesia and from these areas to China, Japan, South Korea, Taiwan, the Philippines and Malaysia.
Company Coordinates
Company Details
C/o Star Bulk Management Inc., 40 Agiou Konstantinou Str, Maroussi ATHINA None : 15124


Registrar Details
InfinHub Market Technologies FZ-LLC, Building-2, Unit 112, Dubai Internet City, Dubai, United Arab Emirates
GET THE MARKETSMOJO APP


Company
Stocks
Portfolio


"Investment in securities markets are subject to market risk. Read all the related documents carefully before investing."