
Compare Star Delta Trans with Similar Stocks
Dashboard
Company has a Debt to Equity ratio (avg) of 0.01 times
Healthy long term growth as Net Sales has grown by an annual rate of 56.47% and Operating profit at 74.70%
With a growth in Operating Profit of 46.8%, the company declared Very Positive results in Mar 26
With ROE of 13.2, it has a Very Attractive valuation with a 1.8 Price to Book Value
Majority shareholders : Promoters
Stock DNA
Heavy Electrical Equipment
INR 175 Cr (Micro Cap)
14.00
56
0.00%
0.04
13.21%
1.81
Total Returns (Price + Dividend) 
Latest dividend: 0.5 per share ex-dividend date: Sep-18-2015
Risk Adjusted Returns v/s
Returns Beta

News

Star Delta Transformers Ltd Upgraded to Buy on Strong Financial and Valuation Metrics
Star Delta Transformers Ltd has been upgraded from a Hold to a Buy rating following a comprehensive reassessment of its quality, valuation, financial trend, and technical parameters. The company’s robust quarterly performance, attractive valuation multiples, and improving fundamentals have collectively driven this positive revision in its investment outlook.
Read full news article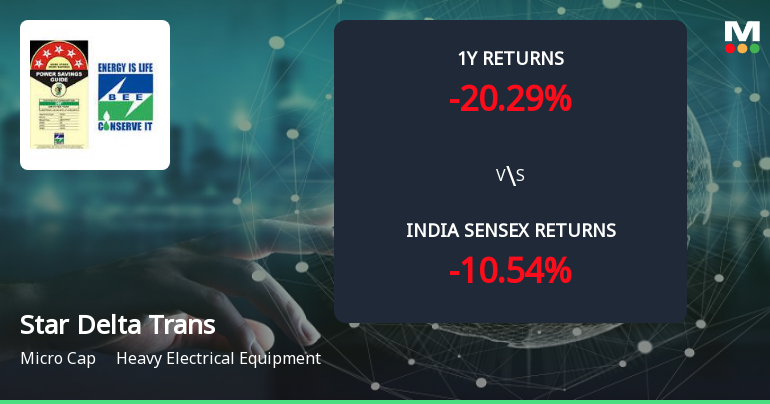
Golden Cross Forms in Star Delta Transformers Ltd — On a Day the Stock Gained 0.29%. What the Mixed Signals Mean
The 50-day moving average has crossed above the 200-day moving average for Star Delta Transformers Ltd, signalling a golden cross on 8 Jun 2026. Yet, the daily price gain of just 0.29% and a mixed technical backdrop suggest the signal is far from straightforward.
Read full news article
Star Delta Transformers Ltd Reports Strong Quarterly Upswing Amid Sector Challenges
Star Delta Transformers Ltd has delivered a robust quarterly performance in March 2026, marking a significant turnaround from its previous flat financial trend. The company’s net sales surged by 23.41% to ₹46.44 crores, accompanied by record-high profitability metrics, signalling renewed operational strength in the heavy electrical equipment sector.
Read full news article Announcements
Announcement Under Regulation 30 (LODR)-Newspaper Publication.
01-Jun-2026 | Source : BSENewspaper announcement of Financial Results of 4th Quarter and Financial Year ended on 31st March 2026 of Star Delta Transformers Limited.
Announcement Under Regulation 30 (LODR)-Newspaper Publication.
01-Jun-2026 | Source : BSENewspaper announcement of Financial Results of 4th Quarter and Financial Year ended on 31st March 2026 of Star Delta Transformers Limited.
Disclosure Under Regulation 23(9) Of SEBI LODR Regulation - Related Party Transaction Report For Half Year Ended 31St March 2026.
30-May-2026 | Source : BSEDetails of Related Party Transactions of Star Delta Transformers Limited for the Half Year ended 31st March 2026
Corporate Actions

No Upcoming Board Meetings

Star Delta Transformers Ltd has declared 5% dividend, ex-date: 18 Sep 15

No Splits history available

No Bonus history available

No Rights history available
Quality key factors
Valuation key factors
Technicals key factors
 Technical Indicator Scale: Bearish, Mildly Bearish, Sideways, Mildly Bullish, Bullish Turned
 Shareholding Snapshot : Mar 2026
Shareholding Compare (%holding)
Promoters
None
Held by 0 Schemes
Held by 0 FIIs
None
Snehlata Kothari (2.58%)
24.29%
Quarterly Results Snapshot (Standalone) - Mar'26 - YoY

YoY Growth in quarter ended Mar 2026 is 23.41% vs -1.70% in Mar 2025
YoY Growth in quarter ended Mar 2026 is 44.44% vs 44.34% in Mar 2025
Half Yearly Results Snapshot (Standalone) - Sep'25

Growth in half year ended Sep 2025 is 3.32% vs 7.14% in Sep 2024
Growth in half year ended Sep 2025 is 15.13% vs -17.25% in Sep 2024
Nine Monthly Results Snapshot (Standalone) - Dec'25
YoY Growth in nine months ended Dec 2025 is 21.46% vs 2.33% in Dec 2024
YoY Growth in nine months ended Dec 2025 is 9.79% vs -16.00% in Dec 2024
Annual Results Snapshot (Standalone) - Mar'26
YoY Growth in year ended Mar 2026 is 21.99% vs 1.22% in Mar 2025
YoY Growth in year ended Mar 2026 is 12.32% vs -4.41% in Mar 2025
About Star Delta Transformers Ltd

Company Coordinates


