
Compare Steel Exchange with Similar Stocks
Dashboard
Weak Long Term Fundamental Strength with an average Return on Capital Employed (ROCE) of 8.86%
- Poor long term growth as Net Sales has grown by an annual rate of 3.35% and Operating profit at 2.37% over the last 5 years
- Low ability to service debt as the company has a high Debt to EBITDA ratio of 3.19 times
The company has declared positive results in Mar'2026 after 2 consecutive negative quarters
With ROCE of 8.8, it has a Attractive valuation with a 1.7 Enterprise value to Capital Employed
Market Beating Performance
Stock DNA
Iron & Steel Products
INR 1,533 Cr (Micro Cap)
57.00
26
0.00%
0.52
3.52%
2.00
Total Returns (Price + Dividend) 
Latest dividend: 0.1 per share ex-dividend date: Sep-24-2009
Risk Adjusted Returns v/s
Returns Beta

News
When is the next results date for Steel Exchange India Ltd?
The next results date for Steel Exchange India Ltd is scheduled for 20 July 2026....
Read full news article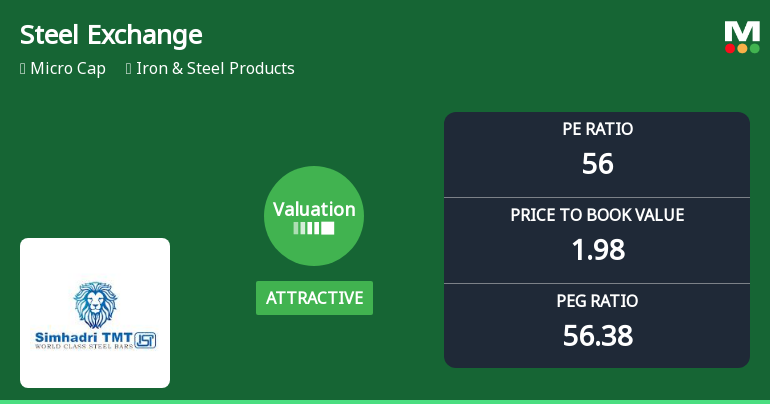
Steel Exchange India Ltd Valuation Shifts Signal Renewed Price Attractiveness
Steel Exchange India Ltd has seen a notable shift in its valuation parameters, moving from a fair to an attractive rating despite recent share price declines. This change reflects evolving market perceptions amid a challenging iron and steel sector backdrop, with the company’s price-to-earnings (P/E) and price-to-book value (P/BV) ratios now presenting a more compelling investment case relative to peers and historical averages.
Read full news article
Steel Exchange India Ltd is Rated Hold
Steel Exchange India Ltd is rated 'Hold' by MarketsMOJO, with this rating last updated on 25 May 2026. However, the analysis and financial metrics discussed here reflect the stock's current position as of 07 July 2026, providing investors with the latest insights into its performance and outlook.
Read full news article Announcements
STEEL EXCHANGE INDIA LIMITED - Other General Purpose
09-Dec-2019 | Source : NSESTEEL EXCHANGE INDIA LIMITED has informed the Exchange regarding Related Party Transactions for the half year ended September 30, 2019 as per Regulation 23(9) of the SEBI (Listing Obligations and Disclosure Requirements) Regulations, 2015.
STEEL EXCHANGE INDIA LIMITED - Outcome of Board Meeting
08-Nov-2019 | Source : NSESTEEL EXCHANGE INDIA LIMITED has informed the Exchange regarding Board meeting held on November 08, 2019.
STEEL EXCHANGE INDIA LIMITED - Updates
30-Oct-2019 | Source : NSESTEEL EXCHANGE INDIA LIMITED has informed the Exchange regarding 'Certificate under Regulation 74(5) of SEBI (Depositories and Participants) Regulations, 2018 for the Quarter ended 30th September, 2019'.
Corporate Actions

20 Jul 2026

Steel Exchange India Ltd has declared 10% dividend, ex-date: 24 Sep 09

Steel Exchange India Ltd has announced 1:10 stock split, ex-date: 12 Jul 22

No Bonus history available

No Rights history available
Quality key factors
Valuation key factors
Technicals key factors
 Technical Indicator Scale: Bearish, Mildly Bearish, Sideways, Mildly Bullish, Bullish Turned
 Shareholding Snapshot : Apr 2026
Shareholding Compare (%holding)
Promoters
99.9475
Held by 3 Schemes (0.0%)
Held by 7 FIIs (0.29%)
Umashiv Garments Private Ltd (19.3%)
Vishwa Samudra Holdings Private Limited (4.74%)
32.54%
Quarterly Results Snapshot (Standalone) - Mar'26 - QoQ

QoQ Growth in quarter ended Mar 2026 is 19.55% vs 3.71% in Dec 2025
QoQ Growth in quarter ended Mar 2026 is 442.54% vs 8.06% in Dec 2025
Half Yearly Results Snapshot (Standalone) - Sep'25
Growth in half year ended Sep 2025 is 1.44% vs 0.68% in Sep 2024

Growth in half year ended Sep 2025 is 132.39% vs 158.48% in Sep 2024
Nine Monthly Results Snapshot (Standalone) - Dec'25
YoY Growth in nine months ended Dec 2025 is -9.35% vs 9.62% in Dec 2024
YoY Growth in nine months ended Dec 2025 is -30.94% vs 338.67% in Dec 2024
Annual Results Snapshot (Standalone) - Mar'26
YoY Growth in year ended Mar 2026 is -7.39% vs 5.04% in Mar 2025
YoY Growth in year ended Mar 2026 is 4.09% vs 138.11% in Mar 2025
About Steel Exchange India Ltd

Company Coordinates


