
Compare Steel Partners Holdings LP with Similar Stocks
Total Returns (Price + Dividend) 
Steel Partners Holdings LP for the last several years.
Risk Adjusted Returns v/s
News
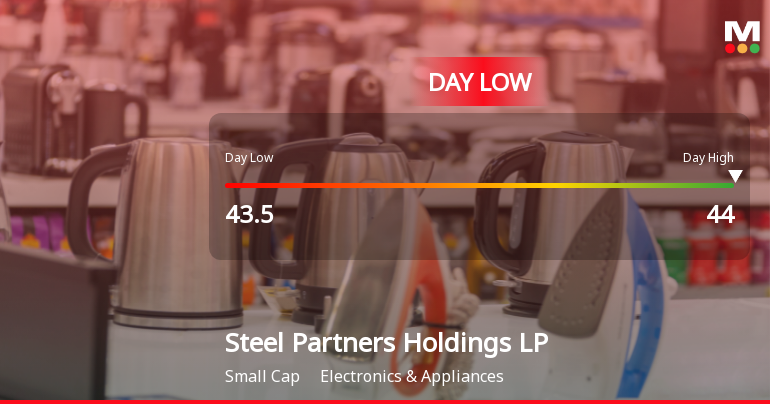
Steel Partners Holdings LP Hits Day Low of $43.50 Amid Price Pressure
Steel Partners Holdings LP saw a notable decline in its stock price, contrasting with the S&P 500's modest decrease. Despite recent challenges, the company has shown resilience with positive long-term growth indicators, including a strong return on equity and significant operating profit growth, maintaining a premium valuation in its sector.
Read full news article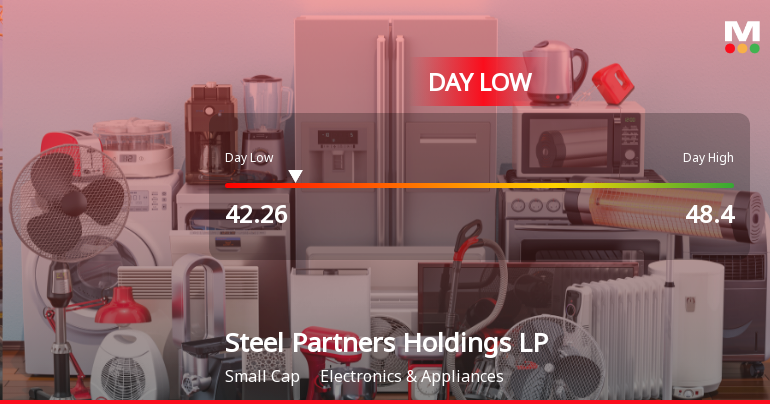
Steel Partners Holdings LP Hits Day Low of $42.26 Amid Price Pressure
Steel Partners Holdings LP faced a notable decline in its stock price today, reaching an intraday low. Despite this downturn, the company has shown positive performance over the past month and maintains a strong market position in the Electronics & Appliances industry, supported by solid financial metrics.
Read full news article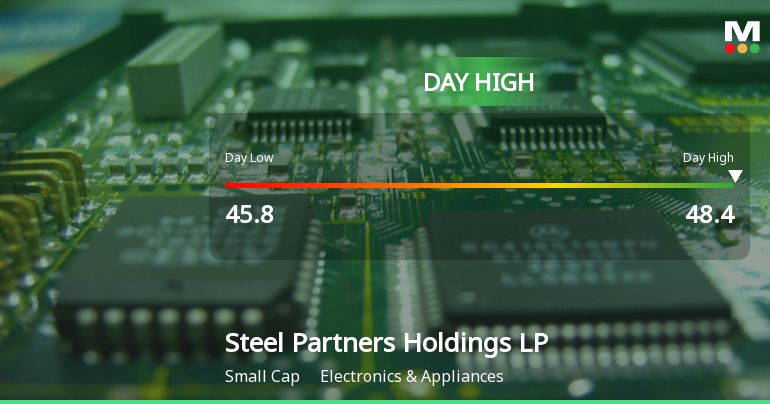
Steel Partners Holdings LP Surges to Intraday High with 11.91% Gain
Steel Partners Holdings LP recorded a strong intraday performance on 23 Dec 2025, surging 11.91% to touch a day’s high of USD 48.40, significantly outperforming the S&P 500 index which rose 0.64% on the same day.
Read full news article Announcements

Corporate Actions
Quality key factors
Valuation key factors
Technicals key factors
 Technical Indicator Scale: Bearish, Mildly Bearish, Sideways, Mildly Bullish, Bullish Turned
 Shareholding Snapshot : Sep 2025
Shareholding Compare (%holding)
Domestic Funds
Held in 1 Schemes (3.11%)
Held by 2 Foreign Institutions (0.15%)
Quarterly Results Snapshot (Consolidated) - Sep'25 - QoQ

QoQ Growth in quarter ended Sep 2025 is -1.60% vs 10.59% in Jun 2025
QoQ Growth in quarter ended Sep 2025 is -7.29% vs 163.92% in Jun 2025
Annual Results Snapshot (Consolidated) - Dec'24
YoY Growth in year ended Dec 2024 is 6.38% vs 12.46% in Dec 2023

YoY Growth in year ended Dec 2024 is 76.10% vs -25.32% in Dec 2023
About Steel Partners Holdings LP

Company Coordinates


