
Compare Steelcast with Similar Stocks
Dashboard
High Management Efficiency with a high ROE of 25.20%
Company has a Debt to Equity ratio (avg) of 0.09 times
Healthy long term growth as Operating profit has grown by an annual rate 41.67%
With ROE of 22, it has a Very Expensive valuation with a 7.8 Price to Book Value
Majority shareholders : Non Institution
Market Beating performance in long term as well as near term
Stock DNA
Castings & Forgings
INR 3,132 Cr (Small Cap)
36.00
42
0.56%
-0.19
21.99%
7.84
Total Returns (Price + Dividend) 
Latest dividend: 0.4488061021445943 per share ex-dividend date: Feb-06-2026
Risk Adjusted Returns v/s
Returns Beta

News
Steelcast Ltd is Rated Hold by MarketsMOJO
Steelcast Ltd is rated 'Hold' by MarketsMOJO, with this rating last updated on 01 June 2026. However, the analysis and financial metrics discussed here reflect the stock's current position as of 18 June 2026, providing investors with an up-to-date perspective on the company’s performance and outlook.
Read full news article
Steelcast Ltd Technical Momentum Shifts Signal Bullish Outlook Amid Mixed Indicators
Steelcast Ltd, a small-cap player in the Castings & Forgings sector, has recently exhibited a notable shift in its technical momentum, moving from a mildly bullish stance to a more confident bullish trend. This transition is underscored by a combination of technical indicators, including MACD, RSI, moving averages, and Bollinger Bands, which collectively paint a nuanced picture of the stock’s near-term prospects amid mixed signals from weekly and monthly charts.
Read full news article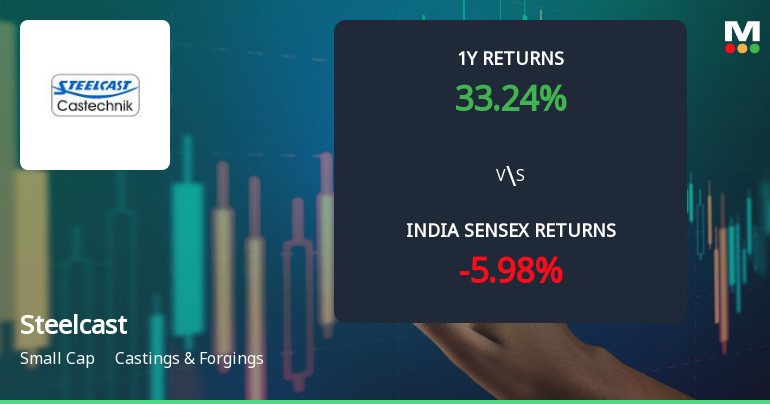
Steelcast Ltd Technical Momentum Shifts Amid Mixed Indicator Signals
Steelcast Ltd, a small-cap player in the Castings & Forgings sector, has experienced a nuanced shift in its technical momentum, reflecting a complex interplay of bullish and bearish signals across key indicators. Despite a modest day gain of 1.09%, the stock’s recent technical parameter changes suggest a transition from a strongly bullish stance to a more cautiously optimistic outlook, prompting a downgrade in its Mojo Grade from Buy to Hold as of 26 May 2026.
Read full news article Announcements
Announcement under Regulation 30 (LODR)-Analyst / Investor Meet - Intimation
17-Jun-2026 | Source : BSEIntimation of Investor Meeting/Broker Conference under the SEBI (Listing Obligations and Disclosure Requirements) Regulations 2015
Announcement under Regulation 30 (LODR)-Earnings Call Transcript
08-Jun-2026 | Source : BSETranscript of the earnings conference call for the Q4FY26 ended on March 31 2026
Announcement under Regulation 30 (LODR)-Analyst / Investor Meet - Outcome
01-Jun-2026 | Source : BSEAudio recording of the Earnings Conference call for Q4FY26
Corporate Actions

No Upcoming Board Meetings

Steelcast Ltd has declared 45% dividend, ex-date: 06 Feb 26

Steelcast Ltd has announced 1:5 stock split, ex-date: 29 Aug 25

Steelcast Ltd has announced 1:1 bonus issue, ex-date: 25 Jul 12

No Rights history available
Quality key factors
Valuation key factors
Technicals key factors
 Technical Indicator Scale: Bearish, Mildly Bearish, Sideways, Mildly Bullish, Bullish Turned
 Shareholding Snapshot : Mar 2026
Shareholding Compare (%holding)
Non Institution
3.2938
Held by 1 Schemes (1.33%)
Held by 18 FIIs (0.25%)
Chetan M Tamboli (16.4%)
Gautam Doshi (3.01%)
31.98%
Quarterly Results Snapshot (Standalone) - Mar'26 - YoY

YoY Growth in quarter ended Mar 2026 is -6.38% vs 22.04% in Mar 2025
YoY Growth in quarter ended Mar 2026 is -13.41% vs 43.08% in Mar 2025
Half Yearly Results Snapshot (Standalone) - Sep'25

Growth in half year ended Sep 2025 is 39.62% vs -30.89% in Sep 2024
Growth in half year ended Sep 2025 is 64.38% vs -32.54% in Sep 2024
Nine Monthly Results Snapshot (Standalone) - Dec'25
YoY Growth in nine months ended Dec 2025 is 22.05% vs -18.24% in Dec 2024
YoY Growth in nine months ended Dec 2025 is 40.19% vs -19.29% in Dec 2024
Annual Results Snapshot (Standalone) - Mar'26
YoY Growth in year ended Mar 2026 is 13.33% vs -8.89% in Mar 2025
YoY Growth in year ended Mar 2026 is 20.30% vs -3.73% in Mar 2025
About Steelcast Ltd

Company Coordinates


