
Compare STEL Holdings with Similar Stocks
Dashboard
The company is Net-Debt Free
Poor long term growth as Operating profit has grown by an annual rate 17.26% of over the last 5 years
Flat results in Mar 26
With ROE of 1.2, it has a Very Expensive valuation with a 0.6 Price to Book Value
Despite the size of the company, domestic mutual funds hold only 0.13% of the company
Consistent Returns over the last 3 years
Stock DNA
Non Banking Financial Company (NBFC)
INR 1,018 Cr (Micro Cap)
51.00
21
0.00%
0.00
1.25%
0.63
Total Returns (Price + Dividend) 
STEL Holdings for the last several years.
Risk Adjusted Returns v/s
Returns Beta

News

Golden Cross Forms in STEL Holdings Ltd — Mixed Technical Signals and Micro-Cap Context
The 50-day moving average has crossed above the 200-day moving average for STEL Holdings Ltd, signalling a golden cross on 12 Jun 2026. Yet, the broader technical picture is nuanced, with monthly indicators showing mild bearishness and the stock’s micro-cap status raising questions about signal reliability.
Read full news article
STEL Holdings Ltd is Rated Hold
STEL Holdings Ltd is rated 'Hold' by MarketsMOJO, with this rating last updated on 04 June 2026. However, the analysis and financial metrics discussed here reflect the stock's current position as of 09 June 2026, providing investors with the latest insights into the company’s performance and outlook.
Read full news article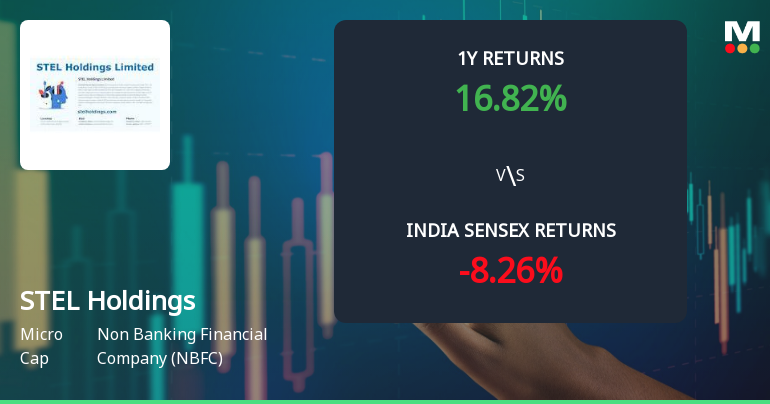
STEL Holdings Ltd Sees Technical Momentum Shift Amid Mixed Indicator Signals
STEL Holdings Ltd, a micro-cap player in the Non Banking Financial Company (NBFC) sector, has experienced a notable shift in its technical momentum, reflected in a 9.93% surge in its share price to ₹486.45 on 3 June 2026. Despite this sharp intraday rally, the company’s overall technical indicators present a complex picture, with mixed signals from MACD, RSI, moving averages, and other momentum oscillators, prompting a recent downgrade in its Mojo Grade from Hold to Sell.
Read full news article Announcements
Announcement under Regulation 30 (LODR)-Newspaper Publication
28-May-2026 | Source : BSEAttaching herewith the newspaper advertisement appeared in Todays Financial Express (English Newspaper) and Deshabhimani (Malayalam Newspaper) regarding audited Financial results for the quarter and year ended March 31 2026
Audited Financial Results For The Quarter And Year Ended March 312026
27-May-2026 | Source : BSEThe Audited Standalone and Consolidated Financial Results for the quarter and year ended March 312026 is enclosed along with the Auditors Report.
Board Meeting Outcome for Board Meeting Outcome For OUTCOME OF THE BOARD MEETING HELD ON MAY 27 2026
27-May-2026 | Source : BSEPursuant to regulation 30 and 33 of the SEBI (LODR)Regulations 2015 the board in its meeting held today Wednesday May 272026 inter -alia considered and approved the financial results for the quarter and year ended March 312026.
Corporate Actions

No Upcoming Board Meetings

No Dividend history available

No Splits history available

No Bonus history available

No Rights history available
Quality key factors
Valuation key factors
Technicals key factors
 Technical Indicator Scale: Bearish, Mildly Bearish, Sideways, Mildly Bullish, Bullish Turned
 Shareholding Snapshot : Mar 2026
Shareholding Compare (%holding)
Promoters
None
Held by 3 Schemes (0.04%)
Held by 4 FIIs (0.01%)
Rainbow Investments Limited (24.5%)
Hitesh Ramji Javeri (4.49%)
24.78%
Quarterly Results Snapshot (Consolidated) - Mar'26 - QoQ

QoQ Growth in quarter ended Mar 2026 is -98.49% vs 85.54% in Dec 2025
QoQ Growth in quarter ended Mar 2026 is -95.87% vs 89.17% in Dec 2025
Half Yearly Results Snapshot (Consolidated) - Sep'25
Growth in half year ended Sep 2025 is 16.91% vs 73.99% in Sep 2024
Growth in half year ended Sep 2025 is 20.52% vs 80.69% in Sep 2024
Nine Monthly Results Snapshot (Consolidated) - Dec'25

YoY Growth in nine months ended Dec 2025 is 216.08% vs 69.54% in Dec 2024
YoY Growth in nine months ended Dec 2025 is 232.26% vs 77.95% in Dec 2024
Annual Results Snapshot (Consolidated) - Mar'26
YoY Growth in year ended Mar 2026 is 25.19% vs 18.69% in Mar 2025
YoY Growth in year ended Mar 2026 is 25.08% vs 19.59% in Mar 2025
About STEL Holdings Ltd

Company Coordinates


