
Compare Stellant Secu. with Similar Stocks
Dashboard
Strong Long Term Fundamental Strength with an average Return on Equity (ROE) of 21.05%
Healthy long term growth as Net Sales has grown by an annual rate of 119.80% and Operating profit at 97.28%
Positive results in Mar 26
With ROE of 27.3, it has a Fair valuation with a 3.9 Price to Book Value
Promoter holding has decreased this quarter and now hold 43.76% of the company
Market Beating Performance
Stock DNA
Non Banking Financial Company (NBFC)
INR 303 Cr (Micro Cap)
14.00
21
0.00%
0.00
27.26%
3.88
Total Returns (Price + Dividend) 
Stellant Secu. for the last several years.
Risk Adjusted Returns v/s
Returns Beta

News

Stellant Securities (India) Ltd is Rated Hold
Stellant Securities (India) Ltd is rated 'Hold' by MarketsMOJO, with this rating last updated on 13 February 2026. However, the analysis and financial metrics discussed here reflect the company’s current position as of 22 June 2026, providing investors with the latest insights into its performance and outlook.
Read full news article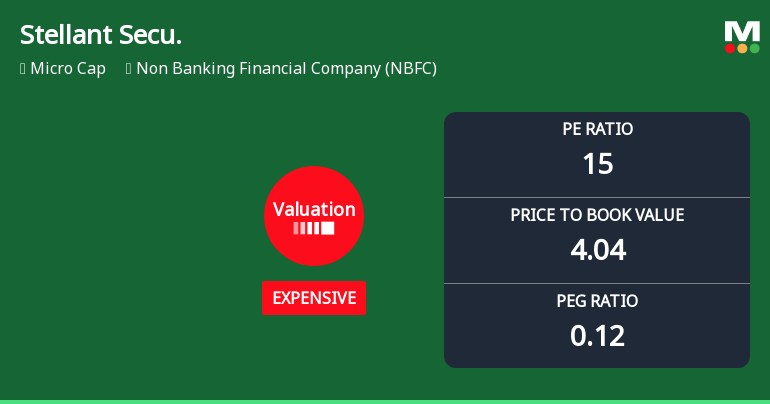
Stellant Securities Valuation Shifts Signal Changing Market Perception
Stellant Securities (India) Ltd has witnessed a notable shift in its valuation parameters, moving from a fair to an expensive rating, despite delivering exceptional returns over recent years. This article analyses the evolving price attractiveness of the micro-cap NBFC, comparing its current valuation metrics against historical averages and peer benchmarks within the sector.
Read full news article
Stellant Securities (India) Ltd is Rated Hold
Stellant Securities (India) Ltd is rated 'Hold' by MarketsMOJO, with this rating last updated on 13 February 2026. However, the analysis and financial metrics discussed here reflect the stock's current position as of 11 June 2026, providing investors with the latest insights into its performance and outlook.
Read full news article Announcements
Closure of Trading Window
18-Jun-2026 | Source : BSEIntimation of closure of trading window
Announcement under Regulation 30 (LODR)-Newspaper Publication
01-Jun-2026 | Source : BSENewspaper Advertisement for the Audited Financial Results for the quarter and year ended 31st March 2026 and Recommendation of Final Dividend Rs.0.20 per shares
Disclosures under Reg. 29(1) of SEBI (SAST) Regulations 2011
01-Jun-2026 | Source : BSEThe Exchange has received the disclosure under Regulation 29(1) of SEBI (Substantial Acquisition of Shares & Takeovers) Regulations 2011 for Subhash Phootarmal Rathod & Mangala Rathod
Corporate Actions

No Upcoming Board Meetings

No Dividend history available

No Splits history available

No Bonus history available

No Rights history available
Quality key factors
Valuation key factors
Technicals key factors
 Technical Indicator Scale: Bearish, Mildly Bearish, Sideways, Mildly Bullish, Bullish Turned
 Shareholding Snapshot : Mar 2026
Shareholding Compare (%holding)
Non Institution
None
Held by 0 Schemes
Held by 0 FIIs
Subhash Phootarmal Rathod . (24.93%)
Stellant Securities (india) Limited (4.18%)
46.68%
Quarterly Results Snapshot (Standalone) - Mar'26 - QoQ

QoQ Growth in quarter ended Mar 2026 is 375.00% vs -96.98% in Dec 2025
QoQ Growth in quarter ended Mar 2026 is -7.54% vs -115.87% in Dec 2025
Half Yearly Results Snapshot (Standalone) - Sep'25
Growth in half year ended Sep 2025 is 0.00% vs 0.00% in Sep 2024
Growth in half year ended Sep 2025 is 2,963.37% vs 1,583.33% in Sep 2024
Nine Monthly Results Snapshot (Standalone) - Dec'25
YoY Growth in nine months ended Dec 2025 is 29,640.00% vs 0.00% in Dec 2024
YoY Growth in nine months ended Dec 2025 is 2,269.37% vs 236.36% in Dec 2024
Annual Results Snapshot (Standalone) - Mar'26
YoY Growth in year ended Mar 2026 is 2,690.06% vs 0.00% in Mar 2025
YoY Growth in year ended Mar 2026 is 1,551.94% vs 258.33% in Mar 2025
About Stellant Securities (India) Ltd

Company Coordinates


