
Compare Step Two Corp. with Similar Stocks
Stock DNA
Non Banking Financial Company (NBFC)
INR 15 Cr (Micro Cap)
NA (Loss Making)
21
0.00%
0.00
-31.08%
2.76
Total Returns (Price + Dividend) 
Step Two Corp. for the last several years.
Risk Adjusted Returns v/s
Returns Beta

News
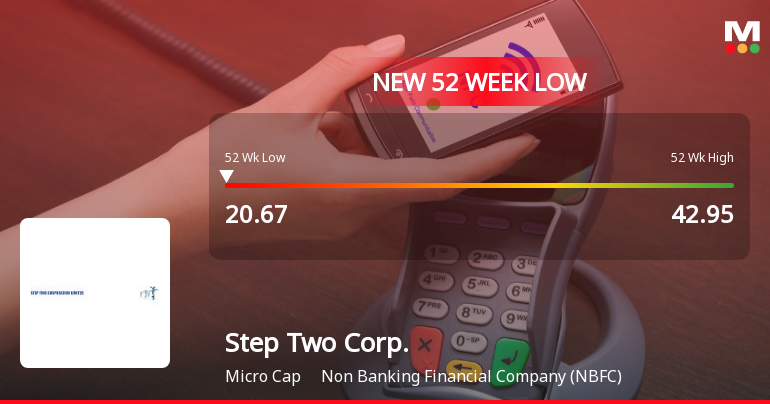
Step Two Corporation Ltd Falls to 52-Week Low of Rs 20.67 as Sell-Off Deepens
For the sixth consecutive session, Step Two Corporation Ltd has closed lower, culminating in a fresh 52-week low of Rs 20.67 on 22 Jun 2026. This marks a 20.22% decline over the past six days, underscoring persistent selling pressure despite broader market gains.
Read full news article
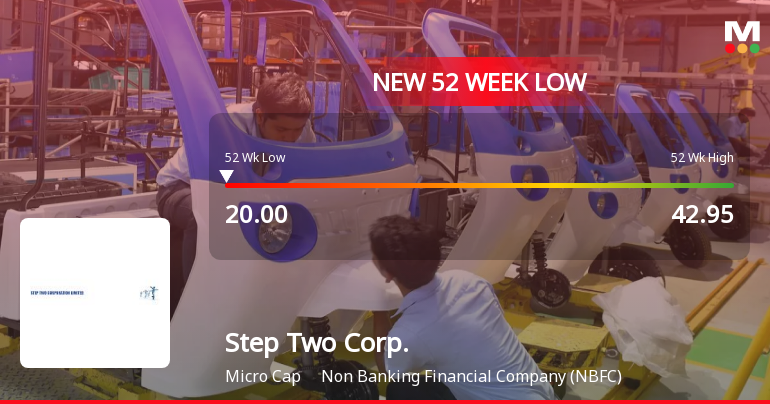
Step Two Corporation Ltd Falls to 52-Week Low of Rs 21.76 as Sell-Off Deepens
For the fifth consecutive session, Step Two Corporation Ltd closed lower, hitting a fresh 52-week low of Rs 21.76 on 19 Jun 2026. This marks a steep 16.02% decline over the past five days, underscoring persistent selling pressure amid a broader market that remains volatile.
Read full news article Announcements
Results-Financial Results March 31 2026
25-May-2026 | Source : BSEResults-Financial Results March 31 2026
Board Meeting Outcome for Outcome Of Board Meeting Held Today
25-May-2026 | Source : BSEOutcome of Board Meeting held today
Board Meeting Intimation for Results For The Period Ended March 2026
13-May-2026 | Source : BSEStep Two Corporation Ltdhas informed BSE that the meeting of the Board of Directors of the Company is scheduled on 25/05/2026 inter alia to consider and approve 1. To consider and take on record the Audited Financial Results of the Company for quarter and year ended 31st March 2026. 2. Any other business with the permission of the Chair.
Corporate Actions

No Upcoming Board Meetings

No Dividend history available

No Splits history available

No Bonus history available

No Rights history available
Quality key factors
Valuation key factors
Technicals key factors
 Technical Indicator Scale: Bearish, Mildly Bearish, Sideways, Mildly Bullish, Bullish Turned
 Shareholding Snapshot : Dec 2025
Shareholding Compare (%holding)
Promoters
None
Held by 0 Schemes
Held by 0 FIIs
Anuj Agarwal (56.33%)
Santosh Kumar Choudhary (6.25%)
42.05%
Quarterly Results Snapshot (Standalone) - Mar'26 - QoQ

QoQ Growth in quarter ended Mar 2026 is 485.19% vs 0.00% in Dec 2025

QoQ Growth in quarter ended Mar 2026 is -538.71% vs 127.93% in Dec 2025
Half Yearly Results Snapshot (Standalone) - Sep'25
Growth in half year ended Sep 2025 is -60.53% vs 98.26% in Sep 2024
Growth in half year ended Sep 2025 is -30.30% vs -197.06% in Sep 2024
Nine Monthly Results Snapshot (Standalone) - Dec'25
YoY Growth in nine months ended Dec 2025 is -38.72% vs 29.83% in Dec 2024
YoY Growth in nine months ended Dec 2025 is 74.77% vs -270.31% in Dec 2024
Annual Results Snapshot (Standalone) - Mar'26
YoY Growth in year ended Mar 2026 is -6.50% vs 1,950.00% in Mar 2025
YoY Growth in year ended Mar 2026 is -9,500.00% vs 93.33% in Mar 2025
About Step Two Corporation Ltd

Company Coordinates


