
Compare Sterling Green with Similar Stocks
Stock DNA
Hotels & Resorts
INR 8 Cr (Micro Cap)
NA (Loss Making)
35
0.00%
1.25
-11.56%
0.75
Total Returns (Price + Dividend) 
Latest dividend: 0.9000 per share ex-dividend date: Sep-21-2011
Risk Adjusted Returns v/s
Returns Beta

News
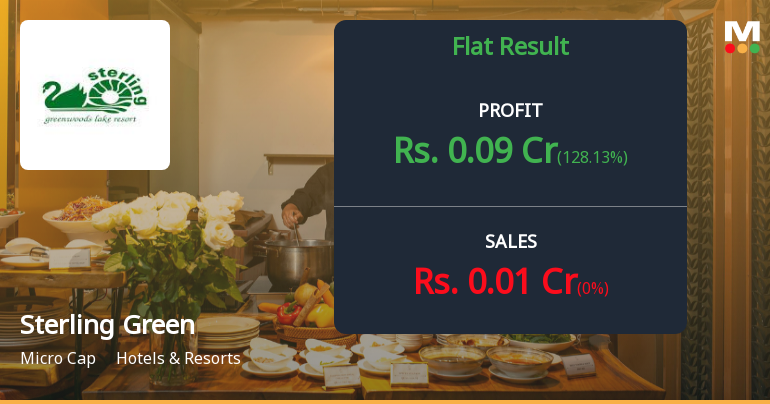
Sterling Green Woods Q4 FY26: Micro-Cap Hotel Company Struggles with Collapsing Revenue and Mounting Losses
Sterling Green Woods Limited, a micro-cap hospitality company with a market capitalisation of just ₹9.00 crores, reported a technical profit of ₹0.09 crores for Q4 FY26, a dramatic reversal from the ₹0.32 crore loss in the previous quarter. However, this positive figure masks a deeply troubling operational reality: the company's revenue has virtually evaporated, plunging 99.12% year-on-year to a mere ₹0.01 crores, whilst the stock has declined 47.13% over the past year, significantly underperforming both the Sensex and its sector peers.
Read full news articleWhen is the next results date for Sterling Green Woods Ltd?
The next results date for Sterling Green Woods Ltd is scheduled for 29 May 2026....
Read full news article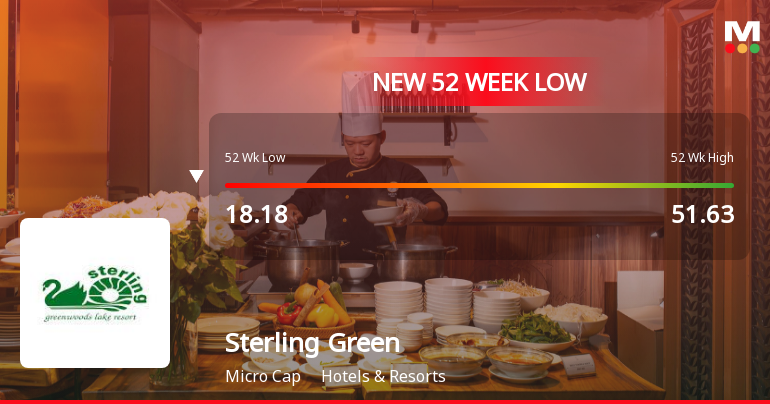
Sterling Green Woods Ltd Falls to 52-Week Low of Rs 16.25 as Sell-Off Deepens
A sharp decline has pushed Sterling Green Woods Ltd to a fresh 52-week low of Rs 16.25 on 2 Apr 2026, marking a significant 68.5% drop from its peak of Rs 51.63 within the last year. This steep fall comes amid a broader market downturn, but the stock’s underperformance far exceeds sector and benchmark indices.
Read full news article Announcements
Announcement under Regulation 30 (LODR)-Newspaper Publication
01-Jun-2026 | Source : BSEAs per Regulations 33 and 47 of the SEBI (Listing Obligations and Disclosure Requirements) Regulations 2015 please find enclosed copies of newspaper cutting of the extracts of standalone and consolidated audited Financial Results of the Company for the quarter and financial year ended on March 31 2026 which are published in English newspaper FREE PRESS GUJARAT and in Vernacular newspaper LOKMITRA on May 31 2026.
Board Meeting Outcome for Outcome Of Meeting Of Board Of Directors Of Sterling Greenwoods Limited (Company) Held On Friday 29Th May 2026.
29-May-2026 | Source : BSEThe Audited Financial Results (Standalone and Consolidated) for the quarter and financial year ended on 31st March 2026; together with Auditors Report with modified opinions on the aforesaid Audited Financial Results (Standalone and Consolidated). 2. The Audited Standalone and Consolidated Financial Statements of the Company for the financial year ended on 31st March 2026.
Submission Of Standalone And Consolidated Audited Financial Results For The Quarter And Financial Year Ended On 31St March 2026 And Disclosure Pursuant To Regulation 33 Of SEBI (LODR) Regulations 2015.
29-May-2026 | Source : BSEThe Audited Financial Results (Standalone and Consolidated) for the quarter and financial year ended on 31st March 2026; together with Auditors Report with modified opinions on the aforesaid Audited Financial Results (Standalone and Consolidated). 2. The Audited Standalone and Consolidated Financial Statements of the Company for the financial year ended on 31st March 2026.
Corporate Actions

No Upcoming Board Meetings

Sterling Green Woods Ltd has declared 9% dividend, ex-date: 21 Sep 11

No Splits history available

No Bonus history available

No Rights history available
Quality key factors
Valuation key factors
Technicals key factors
 Technical Indicator Scale: Bearish, Mildly Bearish, Sideways, Mildly Bullish, Bullish Turned
 Shareholding Snapshot : Mar 2026
Shareholding Compare (%holding)
Non Institution
None
Held by 0 Schemes
Held by 0 FIIs
Umeshbhai Ghanshyambhai Lavingia (48.45%)
Kailash Ramavatar Goenka (5.08%)
49.92%
Quarterly Results Snapshot (Consolidated) - Mar'26 - QoQ
QoQ Growth in quarter ended Mar 2026 is 0.00% vs 0.00% in Dec 2025

QoQ Growth in quarter ended Mar 2026 is 128.12% vs 41.82% in Dec 2025
Half Yearly Results Snapshot (Consolidated) - Sep'25

Growth in half year ended Sep 2025 is -90.32% vs -82.18% in Sep 2024
Growth in half year ended Sep 2025 is 10.43% vs -43.75% in Sep 2024
Nine Monthly Results Snapshot (Consolidated) - Dec'25
YoY Growth in nine months ended Dec 2025 is -87.50% vs -86.27% in Dec 2024
YoY Growth in nine months ended Dec 2025 is 18.18% vs -7.84% in Dec 2024
Annual Results Snapshot (Consolidated) - Mar'26
YoY Growth in year ended Mar 2026 is -95.86% vs -41.77% in Mar 2025
YoY Growth in year ended Mar 2026 is -40.00% vs 51.87% in Mar 2025
About Sterling Green Woods Ltd

Company Coordinates


