
Compare Sterling Powerg. with Similar Stocks
Dashboard
Weak Long Term Fundamental Strength with an average Return on Capital Employed (ROCE) of 4.86%
- Poor long term growth as Operating profit has grown by an annual rate 18.84% of over the last 5 years
- Low ability to service debt as the company has a high Debt to EBITDA ratio of 2.25 times
With a growth in Net Sales of 232.55%, the company declared Very Positive results in Mar 26
With ROCE of 24.3, it has a Fair valuation with a 6 Enterprise value to Capital Employed
Reducing Promoter Confidence
Stock DNA
Industrial Manufacturing
INR 18 Cr (Micro Cap)
20.00
35
0.00%
1.62
71.01%
14.03
Total Returns (Price + Dividend) 
Sterling Powerg. for the last several years.
Risk Adjusted Returns v/s
Returns Beta

News

Sterling Powergensys Ltd Upgraded to Hold on Improved Technicals and Valuation
Sterling Powergensys Ltd, a micro-cap player in the industrial manufacturing sector, has seen its investment rating upgraded from Sell to Hold as of 9 June 2026. This change reflects a nuanced improvement across technical indicators, valuation metrics, and financial trends, despite some lingering concerns over long-term fundamentals and promoter confidence.
Read full news article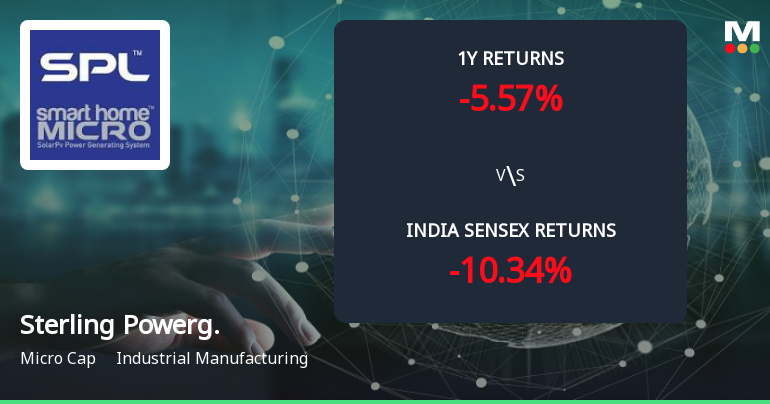
Sterling Powergensys Ltd Forms Golden Cross Amid Mixed Technical Signals and Strong Recent Rally
The 50-day moving average for Sterling Powergensys Ltd has crossed above the 200-day moving average, creating a golden cross on 09 Jun 2026. Yet, this technical event arrives on a day when the stock fell 4.14%, and monthly momentum indicators remain bearish. The signal is valid but layered with contradictions that merit a detailed examination.
Read full news article
Sterling Powergensys Ltd Upgraded to Sell on Improved Financials and Valuation
Sterling Powergensys Ltd, a micro-cap player in the industrial manufacturing sector, has seen its investment rating upgraded from Strong Sell to Sell as of 1 June 2026. This shift reflects significant improvements across financial performance, valuation metrics, and technical indicators, despite lingering concerns over long-term fundamentals and promoter confidence.
Read full news article Announcements
Announcement under Regulation 30 (LODR)-Newspaper Publication
01-Jun-2026 | Source : BSEAs per attachment.
Appointment Of Internal Auditor Of The Company.
29-May-2026 | Source : BSEAs per Attachment
Board Meeting Outcome for Financial Results For Quarter And Year Ended March 31 2026.
29-May-2026 | Source : BSEAs per attachment
Corporate Actions

No Upcoming Board Meetings

No Dividend history available

No Splits history available

No Bonus history available

No Rights history available
Quality key factors
Valuation key factors
Technicals key factors
 Technical Indicator Scale: Bearish, Mildly Bearish, Sideways, Mildly Bullish, Bullish Turned
 Shareholding Snapshot : Mar 2026
Shareholding Compare (%holding)
Non Institution
None
Held by 0 Schemes
Held by 0 FIIs
S Venkata Subramanian (8.82%)
None
49.76%
Quarterly Results Snapshot (Standalone) - Mar'26 - QoQ

QoQ Growth in quarter ended Mar 2026 is 232.55% vs 518.07% in Dec 2025

QoQ Growth in quarter ended Mar 2026 is 1,257.14% vs 56.25% in Dec 2025
Half Yearly Results Snapshot (Standalone) - Sep'25
Growth in half year ended Sep 2025 is -85.29% vs 2,958.33% in Sep 2024
Growth in half year ended Sep 2025 is -1,400.00% vs 113.64% in Sep 2024
Nine Monthly Results Snapshot (Standalone) - Dec'25
YoY Growth in nine months ended Dec 2025 is -42.85% vs 2,412.77% in Dec 2024
YoY Growth in nine months ended Dec 2025 is -783.33% vs -103.82% in Dec 2024
Annual Results Snapshot (Standalone) - Mar'26
YoY Growth in year ended Mar 2026 is 88.89% vs 83.14% in Mar 2025
YoY Growth in year ended Mar 2026 is 421.05% vs -93.31% in Mar 2025
About Sterling Powergensys Ltd

Company Coordinates


