
Compare STL Networks with Similar Stocks
Dashboard
Weak Long Term Fundamental Strength with a 0% CAGR growth in Operating Profits over the last 5 years
- Low ability to service debt as the company has a high Debt to EBITDA ratio of 21.46 times
- The company has been able to generate a Return on Equity (avg) of 109.08% signifying low profitability per unit of shareholders funds
Negative results in Mar 26
Falling Participation by Institutional Investors
Stock DNA
Telecom - Services
INR 1,323 Cr (Micro Cap)
NA (Loss Making)
37
0.00%
0.68
-1.80%
1.13
Total Returns (Price + Dividend) 
STL Networks for the last several years.
Risk Adjusted Returns v/s
Returns Beta

News
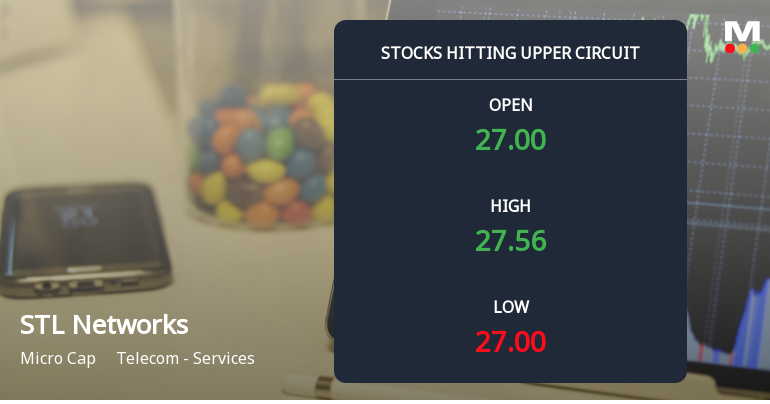
STL Networks Ltd Locks at Upper Circuit With 4.99% Gain — Buyers Queue, Sellers Absent
At Rs 27.56, the buying was done — not because demand dried up, but because the exchange wouldn't let the stock go any higher. STL Networks Ltd locked at its upper circuit of 4.99% on 12 Jun 2026, with buyers queuing and no sellers willing to part with shares.
Read full news article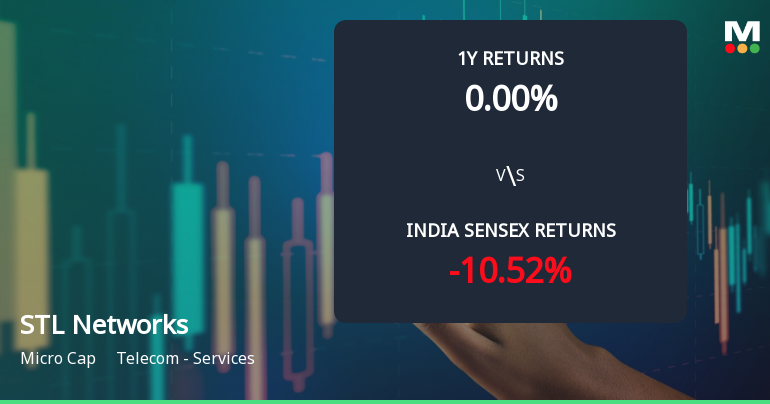
STL Networks Ltd Technical Momentum Shifts Amid Mixed Market Signals
STL Networks Ltd has experienced a notable shift in its technical momentum, moving from a mildly bearish trend to a sideways pattern as of early June 2026. Despite a recent decline in share price, the stock’s mixed technical indicators suggest a complex outlook for investors navigating the micro-cap telecom services sector.
Read full news article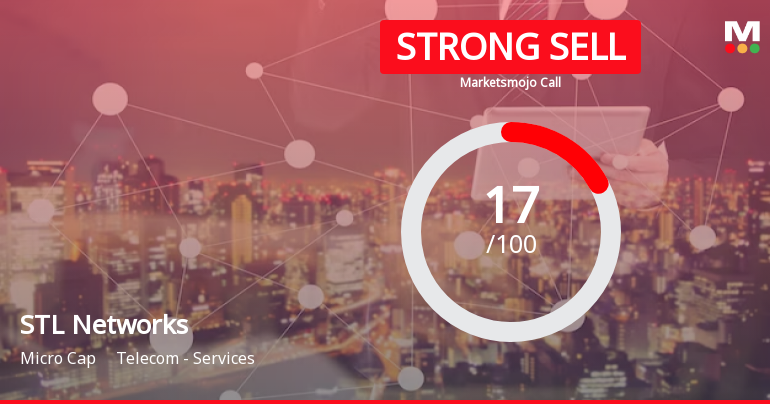
STL Networks Ltd is Rated Strong Sell
STL Networks Ltd is rated Strong Sell by MarketsMOJO, with this rating last updated on 01 June 2026. However, the analysis and financial metrics discussed here reflect the stock’s current position as of 11 June 2026, providing investors with the most up-to-date view of the company’s fundamentals and market performance.
Read full news article Announcements
Announcement under Regulation 30 (LODR)-Change in Management
11-Jun-2026 | Source : BSEAppointment of Mr. Chandrasekhara Rao Battula as Whole Time Director and Interim CEO with effect from June 11 2026
Announcement under Regulation 30 (LODR)-Change in Management
10-Jun-2026 | Source : BSEAppointment of Mr. Chandrasekhara Rao Battula as Whole Time Director and Interim CEO consequent to the resignation of Mr. Pankaj Malik.
Board Meeting Outcome for Outcome Of Board Meeting
10-Jun-2026 | Source : BSEOutcome of Board Meeting
Corporate Actions

No Upcoming Board Meetings

No Dividend history available

No Splits history available

No Bonus history available

No Rights history available
Quality key factors
Valuation key factors
Technicals key factors
 Technical Indicator Scale: Bearish, Mildly Bearish, Sideways, Mildly Bullish, Bullish Turned
 Shareholding Snapshot : Mar 2026
Shareholding Compare (%holding)
Non Institution
None
Held by 4 Schemes (3.94%)
Held by 44 FIIs (0.7%)
Twin Star Overseas Ltd (42.91%)
Uno Metals Ltd (2.51%)
34.71%
Quarterly Results Snapshot (Standalone) - Mar'26 - QoQ

QoQ Growth in quarter ended Mar 2026 is -40.74% vs 53.71% in Dec 2025
QoQ Growth in quarter ended Mar 2026 is -490.18% vs 81.70% in Dec 2025
Half Yearly Results Snapshot (Standalone) - Sep'25
Not Applicable: The company has declared_date for only one period
Not Applicable: The company has declared_date for only one period
Nine Monthly Results Snapshot (Standalone) - Dec'25
Not Applicable: The company has declared_date for only one period
Not Applicable: The company has declared_date for only one period
Annual Results Snapshot (Standalone) - Mar'26
Not Applicable: The company has declared_date for only one period
Not Applicable: The company has declared_date for only one period
About STL Networks Ltd

Company Coordinates


