
Compare STRATA Skin Sciences, Inc. with Similar Stocks
Dashboard
With a Operating Losses, the company has a Weak Long Term Fundamental Strength
- Poor long term growth as Operating profit has grown by an annual rate -33.37% of over the last 5 years
- Company's ability to service its debt is weak with a poor EBIT to Interest (avg) ratio of -4.08
- OPERATING CASH FLOW(Y) Lowest at USD -2.09 MM
- ROCE(HY) Lowest at -235.41%
- DEBT-EQUITY RATIO (HY) Highest at 3,372.4 %
Risky - Negative Operating Profits
Consistent Underperformance against the benchmark over the last 3 years
Stock DNA
Pharmaceuticals & Biotechnology
USD 8 Million (Micro Cap)
NA (Loss Making)
NA
0.00%
6.47
-598.40%
5.74
Total Returns (Price + Dividend) 
STRATA Skin Sciences, Inc. for the last several years.
Risk Adjusted Returns v/s
News

STRATA Skin Sciences Hits 52-Week Low at $1.24 Amid Financial Struggles
STRATA Skin Sciences, Inc. has reached a new 52-week low, reflecting a significant decline in its stock performance over the past year. The company, with a market capitalization of approximately USD 9 million, faces challenges including high debt levels, negative returns on equity, and ongoing operating losses.
Read full news article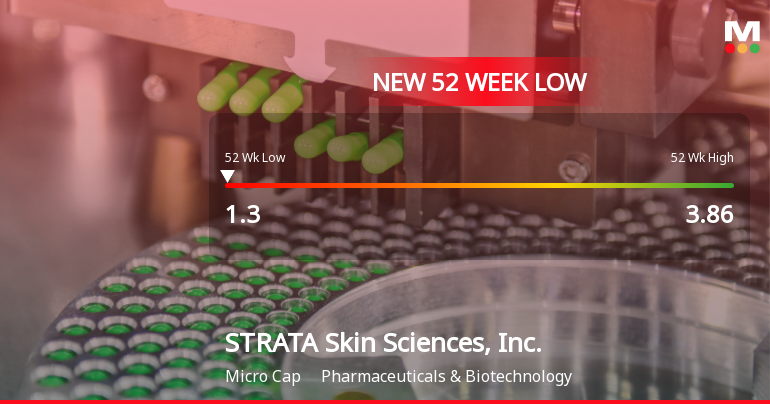
STRATA Skin Sciences Hits New 52-Week Low at $1.30
STRATA Skin Sciences, Inc. has reached a new 52-week low, reflecting a significant decline in its stock value over the past year. The company, with a market capitalization of approximately USD 9 million, faces challenges including high debt levels, negative returns, and operating losses, complicating its financial outlook.
Read full news article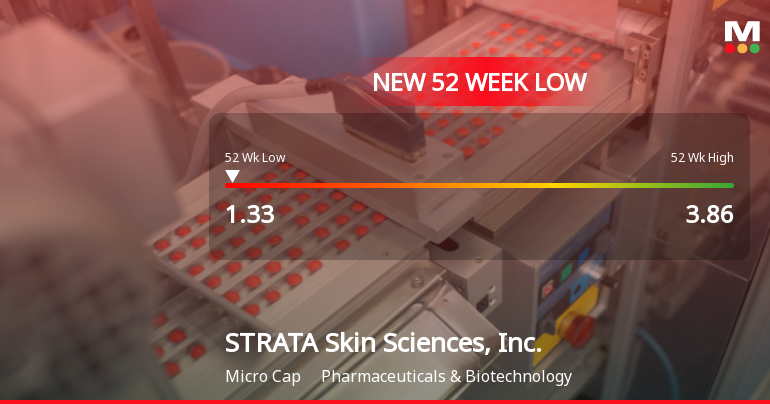
STRATA Skin Sciences Hits 52-Week Low of $1.33 Amid Financial Struggles
STRATA Skin Sciences, Inc. has reached a new 52-week low, reflecting a significant decline in performance over the past year. The company, with a market capitalization of approximately USD 9 million, faces substantial operating losses, high leverage, and weak long-term growth, indicating a challenging financial environment.
Read full news article Announcements

Corporate Actions
Quality key factors
Valuation key factors
Technicals key factors
 Technical Indicator Scale: Bearish, Mildly Bearish, Sideways, Mildly Bullish, Bullish Turned
 Shareholding Snapshot : Sep 2025
Shareholding Compare (%holding)
Domestic Funds
Held in 4 Schemes (1.52%)
Held by 3 Foreign Institutions (0.01%)
Quarterly Results Snapshot (Consolidated) - Jun'25 - QoQ

QoQ Growth in quarter ended Jun 2025 is 13.24% vs -29.17% in Mar 2025

QoQ Growth in quarter ended Jun 2025 is -4.17% vs 46.67% in Mar 2025
Annual Results Snapshot (Consolidated) - Dec'24
YoY Growth in year ended Dec 2024 is 0.60% vs -7.73% in Dec 2023
YoY Growth in year ended Dec 2024 is 6.48% vs -96.36% in Dec 2023
About STRATA Skin Sciences, Inc.

Company Coordinates


