
Compare Stratmont Indus. with Similar Stocks
Dashboard
Low ability to service debt as the company has a high Debt to EBITDA ratio of 3.75 times
- Low ability to service debt as the company has a high Debt to EBITDA ratio of 3.75 times
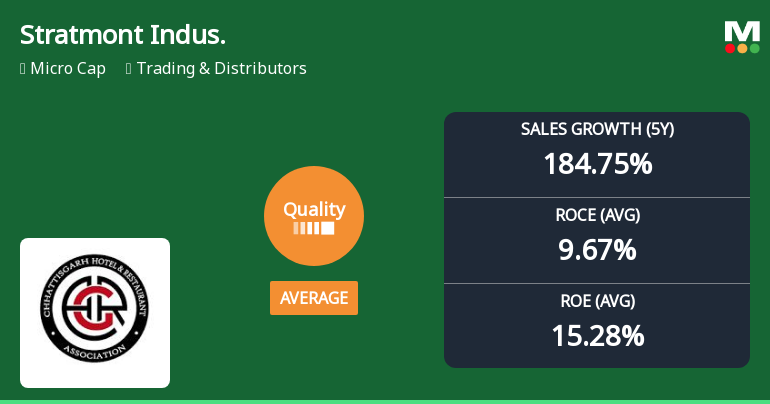
- The company has been able to generate a Return on Capital Employed (avg) of 8.24% signifying low profitability per unit of total capital (equity and debt)
With ROCE of 10.6, it has a Expensive valuation with a 4 Enterprise value to Capital Employed
Stock DNA
Trading & Distributors
INR 194 Cr (Micro Cap)
72.00
NA
0.15%
0.65
8.17%
6.04
Total Returns (Price + Dividend) 
Latest dividend: 0.10000000000000002 per share ex-dividend date: Feb-26-2026
Risk Adjusted Returns v/s
Returns Beta

News
Stratmont Industries Ltd Downgraded to Average Quality Amid Mixed Fundamental Trends
Stratmont Industries Ltd, a micro-cap player in the Trading & Distributors sector, has seen its quality grading slip from good to average as of 10 September 2025. This downgrade reflects a nuanced shift in the company’s business fundamentals, including key metrics such as return on equity (ROE), return on capital employed (ROCE), debt levels, and growth consistency. Investors should carefully analyse these changes to understand the implications for the stock’s future performance and risk profile.
Read full news article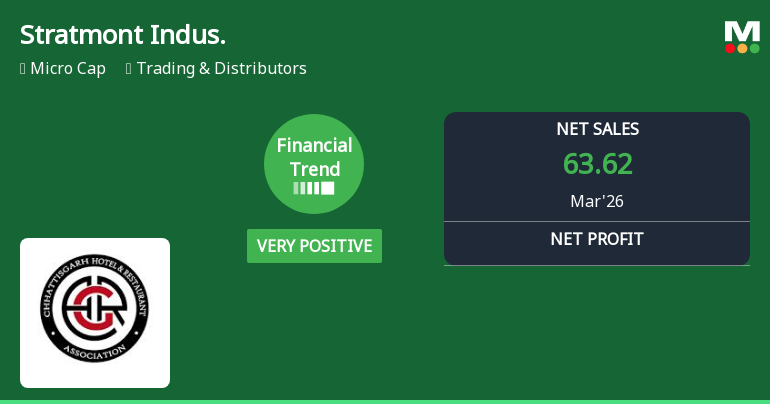
Stratmont Industries Ltd Reports Very Positive Quarterly Financial Performance Amid Mixed Market Returns
Stratmont Industries Ltd has demonstrated a very positive shift in its financial trend for the quarter ended March 2026, marked by record net sales and improved operational efficiency. However, the company’s profitability metrics present a contrasting picture, with quarterly profit after tax (PAT) and earnings per share (EPS) declining sharply. This mixed performance has led to a downgrade in its Mojo Grade from Hold to Sell, reflecting investor caution despite encouraging top-line growth.
Read full news articleAre Stratmont Industries Ltd latest results good or bad?
Stratmont Industries Ltd's latest financial results for Q4 FY26 reveal a significant divergence between strong revenue growth and a troubling decline in profitability. The company reported net sales of ₹63.62 crores, reflecting a year-on-year growth of 115.88%, which is a notable acceleration compared to the previous year. However, despite this robust top-line performance, the net profit fell to zero, marking a complete 100% decline from the prior quarter, raising concerns about the sustainability of its business model. The operating margin also contracted sharply to 1.46% from 7.16% in the previous quarter, indicating severe cost pressures or unfavorable pricing dynamics in its trading operations. Furthermore, the effective tax rate reached an abnormal 100%, consuming all pre-tax profits, which necessitates clarification from management regarding potential one-time adjustments or accounting issues. The c...
Read full news article Announcements
Announcement under Regulation 30 (LODR)-Newspaper Publication
01-Jun-2026 | Source : BSENewspaper Publication of Audited Financial Result for the quarter and year ended 31st March 2026.
Audited Financial Result For The Quarter And Year Ended 31St March 2026.
30-May-2026 | Source : BSEAudited Financial Result for the quarter and year ended 31st March 2026.
Compliances-Reg.24(A)-Annual Secretarial Compliance
30-May-2026 | Source : BSEAnnual Secretarial Compliance Report for the Financial Year 2025-26.
Corporate Actions

No Upcoming Board Meetings

Stratmont Industries Ltd has declared 1% dividend, ex-date: 26 Feb 26

No Splits history available

No Bonus history available

No Rights history available
Quality key factors
Valuation key factors
Technicals key factors
 Technical Indicator Scale: Bearish, Mildly Bearish, Sideways, Mildly Bullish, Bullish Turned
 Shareholding Snapshot : Mar 2026
Shareholding Compare (%holding)
Promoters
None
Held by 2 Schemes (0.03%)
Held by 3 FIIs (27.85%)
Vatsal Agarwaal (64.07%)
Multitude Growth Funds Limited (9.65%)
3.65%
Quarterly Results Snapshot (Standalone) - Mar'26 - YoY

YoY Growth in quarter ended Mar 2026 is 115.88% vs -32.49% in Mar 2025

YoY Growth in quarter ended Mar 2026 is -100.00% vs 16.67% in Mar 2025
Half Yearly Results Snapshot (Standalone) - Sep'25
Growth in half year ended Sep 2025 is 97.04% vs 207.23% in Sep 2024
Growth in half year ended Sep 2025 is 31.25% vs 1,900.00% in Sep 2024
Nine Monthly Results Snapshot (Standalone) - Dec'25
YoY Growth in nine months ended Dec 2025 is 94.53% vs 45.02% in Dec 2024
YoY Growth in nine months ended Dec 2025 is 191.11% vs 40.62% in Dec 2024
Annual Results Snapshot (Standalone) - Mar'26
YoY Growth in year ended Mar 2026 is 101.32% vs 6.25% in Mar 2025
YoY Growth in year ended Mar 2026 is 151.92% vs 36.84% in Mar 2025
About Stratmont Industries Ltd

Company Coordinates


