
Compare String Metaverse with Similar Stocks
Dashboard
Poor Management Efficiency with a low ROE of 8.06%
- The company has been able to generate a Return on Equity (avg) of 8.06% signifying low profitability per unit of shareholders funds
With ROE of 21.8, it has a Expensive valuation with a 5.8 Price to Book Value
Despite the size of the company, domestic mutual funds hold only 0% of the company
Stock DNA
Paper, Forest & Jute Products
INR 933 Cr (Small Cap)
12.00
17
0.00%
-0.06
21.78%
5.88
Total Returns (Price + Dividend) 
String Metaverse for the last several years.
Risk Adjusted Returns v/s
Returns Beta

News
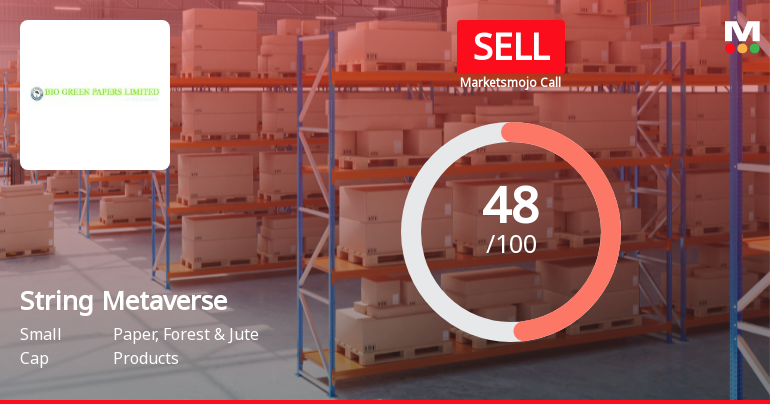
String Metaverse Ltd Downgraded to Sell Amid Technical and Valuation Concerns
String Metaverse Ltd, a small-cap player in the Paper, Forest & Jute Products sector, has seen its investment rating downgraded from Hold to Sell following a comprehensive reassessment of its quality, valuation, financial trends, and technical indicators. The downgrade reflects deteriorating technical signals, an expensive valuation profile, and concerns over management efficiency despite robust sales growth and recent strong quarterly results.
Read full news article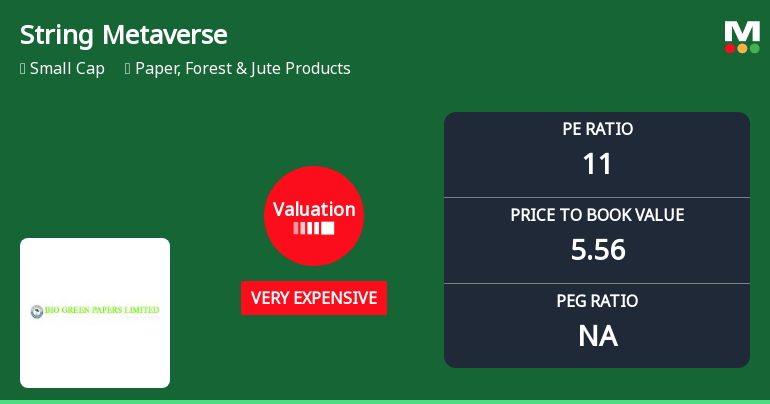
String Metaverse Ltd Valuation Shifts to Very Expensive Amid Steep Price Decline
String Metaverse Ltd, a small-cap player in the Paper, Forest & Jute Products sector, has witnessed a significant shift in its valuation parameters, moving from a previously attractive position to being classified as very expensive. This change comes amid a sharp decline in its share price and a deteriorating market sentiment, prompting a downgrade in its Mojo Grade from Buy to Hold as of 4 December 2025.
Read full news article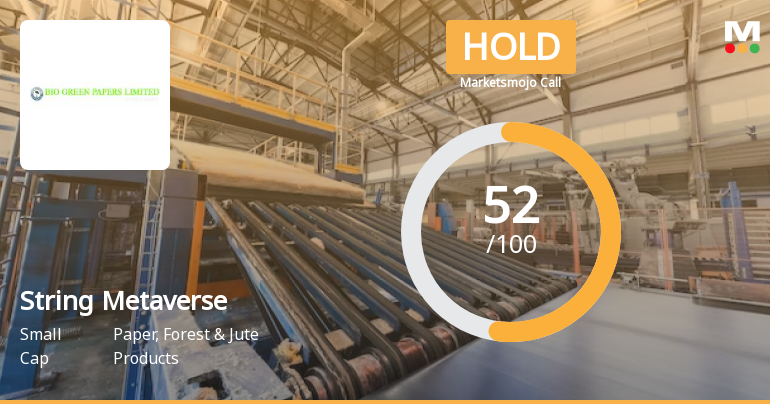
String Metaverse Ltd is Rated Hold by MarketsMOJO
String Metaverse Ltd is rated Hold by MarketsMOJO, with this rating last updated on 04 Dec 2025. However, the analysis and financial metrics discussed here reflect the company’s current position as of 20 June 2026, providing investors with an up-to-date view of its fundamentals, valuation, financial trends, and technical outlook.
Read full news article Announcements
Announcement under Regulation 30 (LODR)-Allotment
22-Jun-2026 | Source : BSEAllotment of Bonus Equity Shares
Disclsoure Under Reg.30 SEBI LODR
22-Jun-2026 | Source : BSEUpdate on Complaince of MPS.
Update On Undertaking Submitted On 08Th June2026
22-Jun-2026 | Source : BSERevised and updated undertaking w.r.t Bonus Issue
Corporate Actions

No Upcoming Board Meetings

No Dividend history available

No Splits history available

No Bonus history available

No Rights history available
Quality key factors
Valuation key factors
Technicals key factors
 Technical Indicator Scale: Bearish, Mildly Bearish, Sideways, Mildly Bullish, Bullish Turned
 Shareholding Snapshot : Dec 2025
Shareholding Compare (%holding)
Promoters
None
Held by 0 Schemes
Held by 1 FIIs (0.0%)
Sri Matha Meenavalli (15.79%)
Vinay Rajendrakumar Nagda (2.43%)
15.17%
Quarterly Results Snapshot (Consolidated) - Dec'25 - YoY

YoY Growth in quarter ended Dec 2025 is 140.60% vs 0.00% in Dec 2024

YoY Growth in quarter ended Dec 2025 is 171.50% vs 12,862.50% in Dec 2024
Half Yearly Results Snapshot (Consolidated) - Sep'25
Growth in half year ended Sep 2025 is 212.99% vs 0.00% in Sep 2024
Growth in half year ended Sep 2025 is 225.80% vs 1,561.45% in Sep 2024
Nine Monthly Results Snapshot (Consolidated) - Dec'25
YoY Growth in nine months ended Dec 2025 is 179.95% vs 0.00% in Dec 2024
YoY Growth in nine months ended Dec 2025 is 200.98% vs 2,554.95% in Dec 2024
Annual Results Snapshot (Consolidated) - Mar'25
YoY Growth in year ended Mar 2025 is 169.40% vs 0.00% in Mar 2024
YoY Growth in year ended Mar 2025 is 224.31% vs 958.73% in Mar 2024
About String Metaverse Ltd

Company Coordinates


