
Compare Styrenix Perfor. with Similar Stocks
Dashboard
High Management Efficiency with a high ROE of 16.52%
Company has a Debt to Equity ratio (avg) of 0.09 times
Poor long term growth as Operating profit has grown by an annual rate 0.52% of over the last 5 years
Flat results in Mar 26
With ROCE of 15, it has a Fair valuation with a 2.5 Enterprise value to Capital Employed
Increasing Participation by Institutional Investors
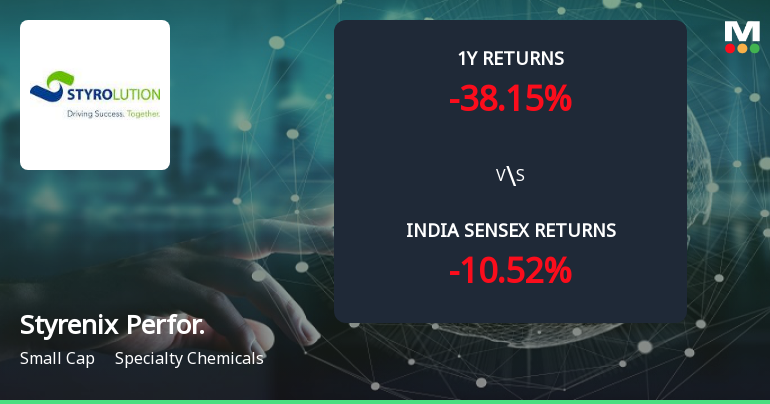
Underperformed the market in the last 1 year
Stock DNA
Specialty Chemicals
INR 3,779 Cr (Small Cap)
20.00
35
2.50%
0.12
13.85%
2.78
Total Returns (Price + Dividend) 
Latest dividend: 23 per share ex-dividend date: Feb-05-2026
Risk Adjusted Returns v/s
Returns Beta

News
Golden Cross Forms in Styrenix Performance Materials Ltd — On a Day the Stock Fell 2.03%. What the Mixed Signals Mean
The 50-day moving average has crossed above the 200-day moving average for Styrenix Performance Materials Ltd, signalling a golden cross on 11 Jun 2026. Yet, the stock declined 2.03% on the same day, and monthly technical indicators remain bearish. This divergence between the moving averages and price action calls for a detailed examination of the signal's reliability.
Read full news article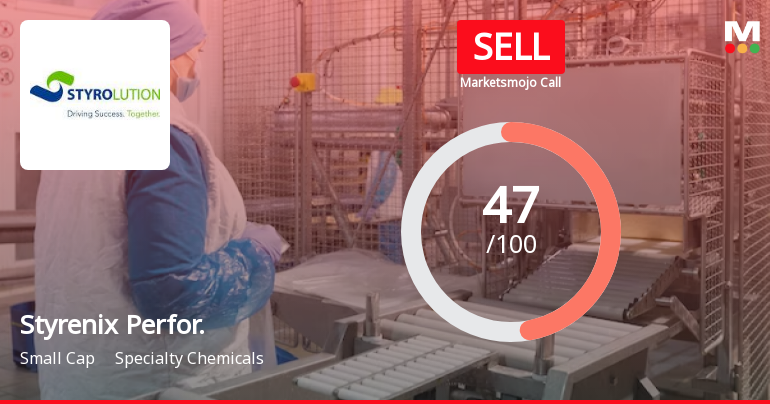
Styrenix Performance Materials Ltd is Rated Sell
Styrenix Performance Materials Ltd is rated 'Sell' by MarketsMOJO, with this rating last updated on 18 May 2026. However, all fundamentals, returns, and financial metrics discussed here reflect the stock's current position as of 03 June 2026, providing investors with the latest comprehensive analysis.
Read full news article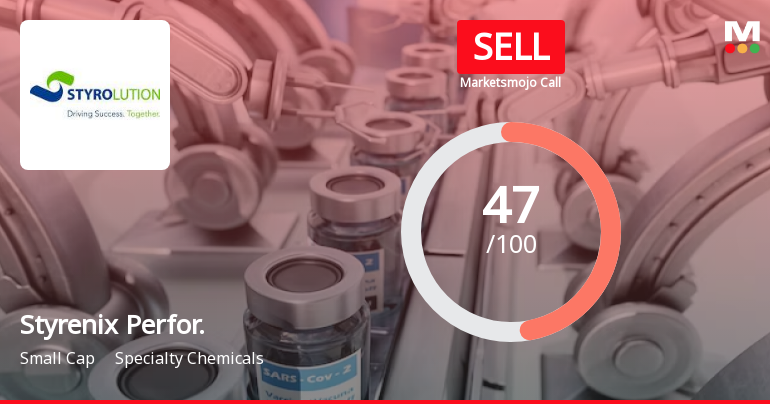
Styrenix Performance Materials Ltd is Rated Sell
Styrenix Performance Materials Ltd is rated 'Sell' by MarketsMOJO, with this rating last updated on 18 May 2026. However, the analysis and financial metrics discussed here reflect the stock's current position as of 23 May 2026, providing investors with the latest insights into its performance and outlook.
Read full news article Announcements
Announcement under Regulation 30 (LODR)-Analyst / Investor Meet - Intimation
01-Jun-2026 | Source : BSEIntimation regarding investor / analyst meet.
Compliances-Reg.24(A)-Annual Secretarial Compliance
28-May-2026 | Source : BSEAnnual Secretarial Compliance Report for the FY ended on March 31 2026.
Announcement under Regulation 30 (LODR)-Earnings Call Transcript
22-May-2026 | Source : BSEEarnings Call Transcript held on May 16 2026.
Corporate Actions

No Upcoming Board Meetings

Styrenix Performance Materials Ltd has declared 230% dividend, ex-date: 05 Feb 26

No Splits history available

No Bonus history available

No Rights history available
Quality key factors
Valuation key factors
Technicals key factors
 Technical Indicator Scale: Bearish, Mildly Bearish, Sideways, Mildly Bullish, Bullish Turned
 Shareholding Snapshot : Mar 2026
Shareholding Compare (%holding)
Promoters
None
Held by 7 Schemes (13.82%)
Held by 30 FIIs (0.95%)
Shiva Performance Materials Private Limited (46.24%)
Nippon Life India Trustee Ltd-a/c Nippon India Small Cap Fund (6.31%)
26.33%
Quarterly Results Snapshot (Consolidated) - Mar'26 - QoQ

QoQ Growth in quarter ended Mar 2026 is -4.99% vs 8.83% in Dec 2025

QoQ Growth in quarter ended Mar 2026 is 349.69% vs -63.46% in Dec 2025
Half Yearly Results Snapshot (Consolidated) - Sep'25
Growth in half year ended Sep 2025 is 28.89% vs 18.72% in Sep 2024
Growth in half year ended Sep 2025 is -26.38% vs 47.77% in Sep 2024
Nine Monthly Results Snapshot (Consolidated) - Dec'25
YoY Growth in nine months ended Dec 2025 is 27.87% vs 25.83% in Dec 2024
YoY Growth in nine months ended Dec 2025 is -36.86% vs 44.56% in Dec 2024
Annual Results Snapshot (Consolidated) - Mar'26
YoY Growth in year ended Mar 2026 is 15.28% vs 34.21% in Mar 2025
YoY Growth in year ended Mar 2026 is -21.77% vs 34.97% in Mar 2025
About Styrenix Performance Materials Ltd

Company Coordinates


