
Compare Sudarshan Chem with Similar Stocks
Stock DNA
Dyes And Pigments
INR 6,986 Cr (Small Cap)
119.00
20
0.50%
0.31
1.74%
2.05
Total Returns (Price + Dividend) 
Latest dividend: 4.492733085060805 per share ex-dividend date: Sep-22-2025
Risk Adjusted Returns v/s
Returns Beta

News
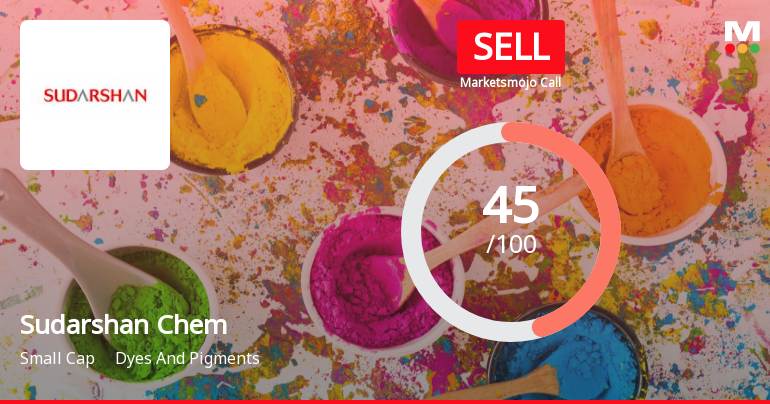
Sudarshan Chemical Industries Ltd is Rated Sell
Sudarshan Chemical Industries Ltd is rated Sell by MarketsMOJO. This rating was last updated on 01 June 2026. However, the analysis and financial metrics discussed below reflect the stock’s current position as of 23 June 2026, providing investors with an up-to-date view of the company’s fundamentals, returns, and market performance.
Read full news article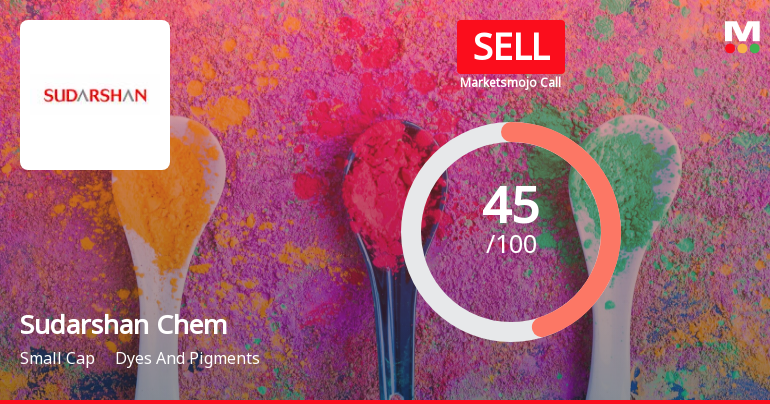
Sudarshan Chemical Industries Ltd is Rated Sell
Sudarshan Chemical Industries Ltd is rated Sell by MarketsMOJO, with this rating last updated on 01 June 2026. However, the analysis and financial metrics discussed here reflect the stock's current position as of 12 June 2026, providing investors with the most recent insights into the company’s performance and outlook.
Read full news article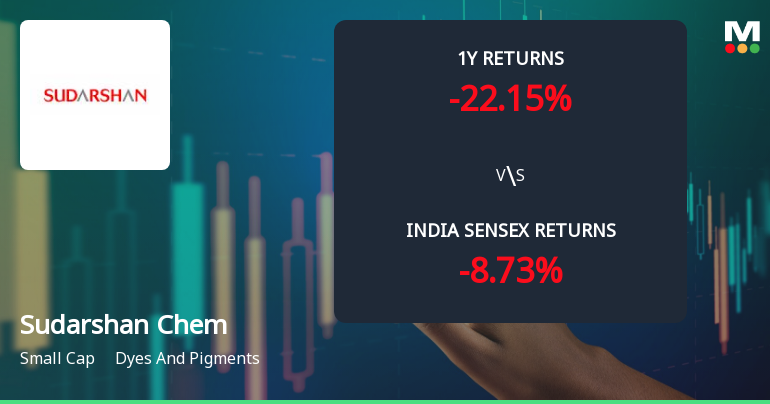
Sudarshan Chemical Industries Ltd Faces Technical Momentum Shift Amid Bearish Signals
Sudarshan Chemical Industries Ltd, a small-cap player in the Dyes and Pigments sector, has experienced a notable shift in its technical momentum, moving from a sideways trend to a mildly bearish stance. Recent technical indicators, including MACD, RSI, and moving averages, reveal a complex picture of mixed signals that suggest cautious investor sentiment amid price volatility.
Read full news article Announcements
Announcement under Regulation 30 (LODR)-Press Release / Media Release
16-Jun-2026 | Source : BSEAnnouncement under Reg. 30 - Submission of Press Release
Announcement under Regulation 30 (LODR)-Analyst / Investor Meet - Intimation
16-Jun-2026 | Source : BSEAnnouncement under Reg 30 - Analyst meet intimation
Announcement under Regulation 30 (LODR)-Analyst / Investor Meet - Intimation
15-Jun-2026 | Source : BSEAnnouncement under Reg. 30 - Intimation of Analyst Meet
Corporate Actions

No Upcoming Board Meetings

Sudarshan Chemical Industries Ltd has declared 225% dividend, ex-date: 22 Sep 25

Sudarshan Chemical Industries Ltd has announced 2:10 stock split, ex-date: 30 Sep 14

Sudarshan Chemical Industries Ltd has announced 1:1 bonus issue, ex-date: 30 Sep 14

No Rights history available
Quality key factors
Valuation key factors
Technicals key factors
 Technical Indicator Scale: Bearish, Mildly Bearish, Sideways, Mildly Bullish, Bullish Turned
 Shareholding Snapshot : Mar 2026
Shareholding Compare (%holding)
Non Institution
None
Held by 12 Schemes (23.3%)
Held by 103 FIIs (7.96%)
Rajesh Balkrishna Rathi (5.15%)
Tata Mutual Fund - Tata Small Cap Fund (7.43%)
47.43%
Quarterly Results Snapshot (Consolidated) - Mar'26 - YoY

YoY Growth in quarter ended Mar 2026 is 106.75% vs 76.57% in Mar 2025
YoY Growth in quarter ended Mar 2026 is 2,019.51% vs -107.07% in Mar 2025
Half Yearly Results Snapshot (Consolidated) - Sep'25
Growth in half year ended Sep 2025 is 268.07% vs 10.00% in Sep 2024
Growth in half year ended Sep 2025 is -0.74% vs -79.17% in Sep 2024
Nine Monthly Results Snapshot (Consolidated) - Dec'25
YoY Growth in nine months ended Dec 2025 is 250.54% vs 12.49% in Dec 2024

YoY Growth in nine months ended Dec 2025 is -194.24% vs -80.01% in Dec 2024
Annual Results Snapshot (Consolidated) - Mar'26
YoY Growth in year ended Mar 2026 is 192.54% vs 31.78% in Mar 2025
YoY Growth in year ended Mar 2026 is -60.00% vs -84.40% in Mar 2025
About Sudarshan Chemical Industries Ltd

Company Coordinates


