
Compare Sudarshan Pharma with Similar Stocks
Stock DNA
Specialty Chemicals
INR 1,002 Cr (Micro Cap)
41.00
36
0.00%
1.85
14.39%
6.35
Total Returns (Price + Dividend) 
Latest dividend: 0.03 per share ex-dividend date: Aug-25-2023
Risk Adjusted Returns v/s
Returns Beta

News
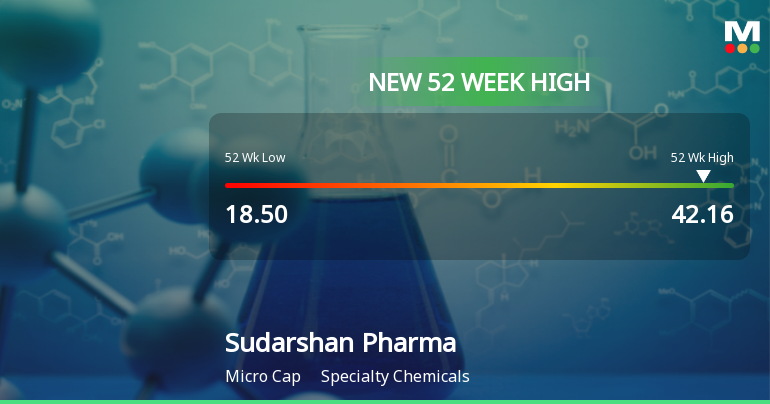
Sudarshan Pharma Industries Ltd Hits New 52-Week High of Rs 42.16 on Back of Strong Technical Signals
From a 52-week low of Rs 18.50 to a fresh high of Rs 42.16 on 15 Jul 2026, Sudarshan Pharma Industries Ltd has surged 128% in the past year, significantly outperforming the Sensex which declined 6.06% over the same period. This remarkable rally is underpinned by a confluence of bullish technical indicators and sustained price momentum, marking a notable milestone for the specialty chemicals micro-cap.
Read full news article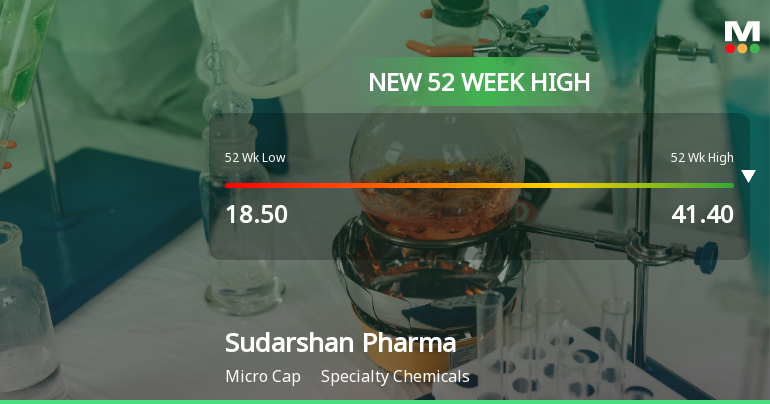
Broad-Based Technical Strength Lifts Sudarshan Pharma Industries Ltd to 52-Week High of Rs 41.4
With a decisive intraday surge to Rs 41.4 on 13 Jul 2026, Sudarshan Pharma Industries Ltd has reached a fresh 52-week high, marking a 39.11% gain over the past year and significantly outperforming the Sensex’s 5.87% decline during the same period.
Read full news article
Sudarshan Pharma Industries Ltd Upgraded to Buy on Strong Technical and Financial Performance
Sudarshan Pharma Industries Ltd has been upgraded from a Hold to a Buy rating, reflecting significant improvements across technical indicators, financial trends, valuation metrics, and overall quality assessments. The micro-cap specialty chemicals company has demonstrated robust operational growth, market-beating returns, and a bullish technical outlook, prompting this positive revision in its investment rating.
Read full news article Announcements
Revised Disclosures under Reg. 31(1) and 31(2) of SEBI (SAST) Regulations 2011.
14-Jul-2026 | Source : BSEThe Exchange has received revised Disclosure under Regulation 31(1) and 31(2) of SEBI (Substantial Acquisition of Shares & Takeovers) Regulations 2011 on July 14 2026 for Hemal Vasantrai Mehta
Compliances-Certificate under Reg. 74 (5) of SEBI (DP) Regulations 2018
07-Jul-2026 | Source : BSEPlease find attached copy of certificates under Regulation 74(5) of SEBI (Depository And Participants) Regulations 2018 received from Kfin Technologies Limited for the quarter ended 30/June/2026.
Closure of Trading Window
30-Jun-2026 | Source : BSEThe Trading Window of the Company shall remain closed with effect from 01/July/2026 untill the expiry of 48 hours after the declaration of the financial results for the quarter ended 30/June/2026.
Corporate Actions

No Upcoming Board Meetings

Sudarshan Pharma Industries Ltd has declared 3% dividend, ex-date: 25 Aug 23

Sudarshan Pharma Industries Ltd has announced 1:10 stock split, ex-date: 22 Nov 24

No Bonus history available

No Rights history available
Quality key factors
Valuation key factors
Technicals key factors
 Technical Indicator Scale: Bearish, Mildly Bearish, Sideways, Mildly Bullish, Bullish Turned
 Shareholding Snapshot : Mar 2026
Shareholding Compare (%holding)
Promoters
None
Held by 0 Schemes
Held by 13 FIIs (19.95%)
Sachin Vasantrai Mehta (27.51%)
Multitude Growth Funds Limited (4.86%)
16.41%
Quarterly Results Snapshot (Standalone) - Mar'26 - QoQ

QoQ Growth in quarter ended Mar 2026 is 26.17% vs -5.17% in Dec 2025
QoQ Growth in quarter ended Mar 2026 is 121.35% vs -2.05% in Dec 2025
Half Yearly Results Snapshot (Consolidated) - Sep'25

Growth in half year ended Sep 2025 is 13.30% vs 21.72% in Mar 2025
Growth in half year ended Sep 2025 is -18.05% vs 114.78% in Mar 2025
Nine Monthly Results Snapshot (Consolidated) - Dec'25
YoY Growth in nine months ended Dec 2025 is 40.39% vs -24.14% in Dec 2024
YoY Growth in nine months ended Dec 2025 is 66.62% vs -51.54% in Dec 2024
Annual Results Snapshot (Consolidated) - Mar'26
YoY Growth in year ended Mar 2026 is 39.21% vs 8.95% in Mar 2025
YoY Growth in year ended Mar 2026 is 55.64% vs 30.63% in Mar 2025
About Sudarshan Pharma Industries Ltd

Company Coordinates


