
Compare Suditi Industrie with Similar Stocks
Stock DNA
Garments & Apparels
INR 411 Cr (Micro Cap)
39.00
26
0.00%
-0.13
16.94%
6.30
Total Returns (Price + Dividend) 
Latest dividend: 0.19148300000000001 per share ex-dividend date: Sep-20-2019
Risk Adjusted Returns v/s
Returns Beta

News

Suditi Industries Ltd is Rated Sell
Suditi Industries Ltd is rated Sell by MarketsMOJO. This rating was last updated on 01 June 2026. However, the analysis and financial metrics discussed here reflect the company’s current position as of 16 July 2026, providing investors with the latest insights into the stock’s fundamentals, valuation, financial trends, and technical outlook.
Read full news article
Suditi Industries Ltd is Rated Sell
Suditi Industries Ltd is rated Sell by MarketsMOJO, with this rating last updated on 01 June 2026. However, the analysis and financial metrics discussed here reflect the stock’s current position as of 05 July 2026, providing investors with the latest insights into the company’s fundamentals, valuation, financial trends, and technical outlook.
Read full news article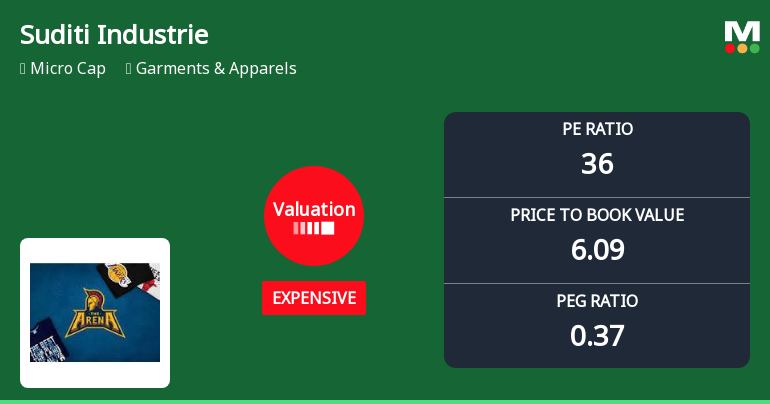
Suditi Industries Ltd: Valuation Shifts Signal Price Attractiveness Challenges
Suditi Industries Ltd, a micro-cap player in the Garments & Apparels sector, has experienced a notable shift in its valuation parameters, moving from a very expensive to an expensive rating. This change reflects evolving market perceptions and has implications for investors assessing the stock’s price attractiveness amid sector peers and historical benchmarks.
Read full news article Announcements
Compliances-Certificate under Reg. 74 (5) of SEBI (DP) Regulations 2018
10-Jul-2026 | Source : BSESubmission of compliance certificate under Regulation 74(5) of SEBI (DP) Regulations2018
Announcement Under Regulation 30 LODR
30-Jun-2026 | Source : BSETrading approval
Announcement under Regulation 30 (LODR)-Newspaper Publication
29-Jun-2026 | Source : BSESubmission of Newspaper Advertisement regarding transfer of Equity Shares to Investor Education and Protection Fund (IEPF)
Corporate Actions

No Upcoming Board Meetings

Suditi Industries Ltd has declared 2% dividend, ex-date: 20 Sep 19

No Splits history available

No Bonus history available

Suditi Industries Ltd has announced 5:9 rights issue, ex-date: 06 Sep 22
Quality key factors
Valuation key factors
Technicals key factors
 Technical Indicator Scale: Bearish, Mildly Bearish, Sideways, Mildly Bullish, Bullish Turned
 Shareholding Snapshot : Apr 2026
Shareholding Compare (%holding)
Promoters
None
Held by 0 Schemes
Held by 1 FIIs (0.17%)
Pawan Kishorilall Agarwal (0.27%)
Prakash Lakhani Huf (7.67%)
27.96%
Quarterly Results Snapshot (Consolidated) - Mar'26 - YoY

YoY Growth in quarter ended Mar 2026 is -14.20% vs 195.42% in Mar 2025
YoY Growth in quarter ended Mar 2026 is -2.75% vs 191.12% in Mar 2025
Half Yearly Results Snapshot (Consolidated) - Sep'25

Growth in half year ended Sep 2025 is 92.16% vs -9.01% in Sep 2024
Growth in half year ended Sep 2025 is 318.26% vs 56.02% in Sep 2024
Nine Monthly Results Snapshot (Consolidated) - Dec'25
YoY Growth in nine months ended Dec 2025 is 52.19% vs 6.96% in Dec 2024
YoY Growth in nine months ended Dec 2025 is 663.25% vs 84.38% in Dec 2024
Annual Results Snapshot (Consolidated) - Mar'26
YoY Growth in year ended Mar 2026 is 27.05% vs 41.01% in Mar 2025
YoY Growth in year ended Mar 2026 is 271.63% vs 123.74% in Mar 2025
About Suditi Industries Ltd

Company Coordinates


