
Compare Sugal & Damani with Similar Stocks
Stock DNA
Non Banking Financial Company (NBFC)
INR 38 Cr (Micro Cap)
9.00
9
0.00%
0.02
13.77%
1.26
Total Returns (Price + Dividend) 
Latest dividend: 0.2 per share ex-dividend date: Jul-15-2013
Risk Adjusted Returns v/s
Returns Beta

News
Sugal & Damani Share Brokers Ltd is Rated Strong Sell
Sugal & Damani Share Brokers Ltd is rated Strong Sell by MarketsMOJO. This rating was last updated on 10 February 2026, reflecting a reassessment of the stock’s outlook. However, the analysis and financial metrics presented here are based on the company’s current position as of 18 June 2026, providing investors with the latest insights into its performance and prospects.
Read full news article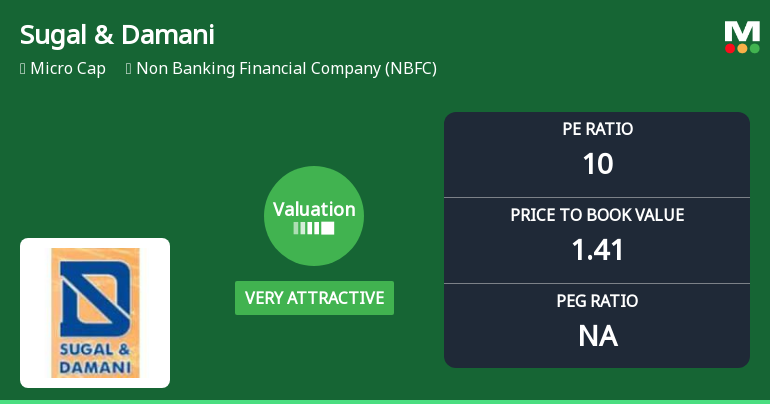
Sugal & Damani Share Brokers Ltd Valuation Shifts to Very Attractive Amid Mixed Market Returns
Sugal & Damani Share Brokers Ltd, a micro-cap player in the Non Banking Financial Company (NBFC) sector, has seen its valuation parameters improve significantly, shifting from attractive to very attractive. Despite a modest day decline of 0.71%, the company’s price-to-earnings (P/E) and price-to-book value (P/BV) ratios now present compelling investment appeal relative to peers and historical averages, supported by robust return metrics and a strong MarketsMOJO rating downgrade to Strong Sell.
Read full news article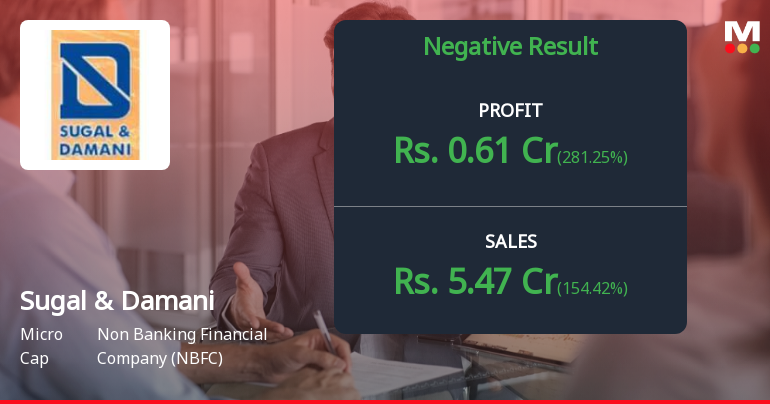
Sugal & Damani Q4 FY26: Sharp Profit Decline Masks Deeper Operational Challenges
Sugal & Damani Share Brokers Ltd., a Chennai-based micro-cap NBFC specialising in share broking and portfolio management services, reported a consolidated net profit of ₹0.61 crores for Q4 FY26, marking a dramatic 62.58% year-on-year decline despite a sequential recovery. The ₹46.00 crore market capitalisation company saw its stock close at ₹66.47 on May 29, down 3.39% on the day, reflecting investor concerns over deteriorating fundamentals and a concerning negative financial trend designation.
Read full news article Announcements
Announcement under Regulation 30 (LODR)-Press Release / Media Release
01-Jun-2026 | Source : BSEThe Results were published in Trinity mirror and Makkal Kural
Compliances-Reg.24(A)-Annual Secretarial Compliance
30-May-2026 | Source : BSEAnnual Secretarial Compliance Report for the F.Y. 31.03.2026
Board Meeting Outcome for Outcome Of Meeting
29-May-2026 | Source : BSEFinancial Results Uploaded
Corporate Actions

No Upcoming Board Meetings

Sugal & Damani Share Brokers Ltd has declared 2% dividend, ex-date: 15 Jul 13

No Splits history available

No Bonus history available

No Rights history available
Quality key factors
Valuation key factors
Technicals key factors
 Technical Indicator Scale: Bearish, Mildly Bearish, Sideways, Mildly Bullish, Bullish Turned
 Shareholding Snapshot : Mar 2026
Shareholding Compare (%holding)
Promoters
None
Held by 0 Schemes
Held by 0 FIIs
Vinodh Kumar S (23.18%)
Lalith Chandak (2.3%)
19.96%
Quarterly Results Snapshot (Consolidated) - Mar'26 - QoQ

QoQ Growth in quarter ended Mar 2026 is 154.42% vs -63.44% in Dec 2025
QoQ Growth in quarter ended Mar 2026 is 281.25% vs -87.79% in Dec 2025
Half Yearly Results Snapshot (Standalone) - Sep'25

Growth in half year ended Sep 2025 is 1.18% vs 458.69% in Sep 2024
Growth in half year ended Sep 2025 is 33.47% vs 64.05% in Sep 2024
Nine Monthly Results Snapshot (Standalone) - Dec'25
YoY Growth in nine months ended Dec 2025 is -21.21% vs 475.40% in Dec 2024
YoY Growth in nine months ended Dec 2025 is 12.50% vs 73.33% in Dec 2024
Annual Results Snapshot (Consolidated) - Mar'26
YoY Growth in year ended Mar 2026 is -22.42% vs 419.26% in Mar 2025
YoY Growth in year ended Mar 2026 is -13.05% vs 105.63% in Mar 2025
About Sugal & Damani Share Brokers Ltd

Company Coordinates


