Sukhjit Starch

  • Market Cap: Micro Cap
  • Industry: Other Agricultural Products
  • ISIN: INE450E01029
  • NSEID: SUKHJITS
  • BSEID: 524542
INR
189.50
6.4 (3.5%)
BSENSE

Mar 05

BSE+NSE Vol: 10.73 k

  • Price Points
  • Score
  • Mojo Parameters
  • Total Return
  • News and Corporate Actions
  • Key factors
  • Shareholding
  • Financials
  • CompanyCV
stock-summaryPrice Point
High/Low

1Day

52 Week

Valuation
Technical
Day's Volume

CASH

10.73 k (-91.60%) Volume

Shareholding (Dec 2025)

FII

0.02%

Held by 1 FIIs

DII

0.00%

Held by 0 DIIs

Promoter

66.07%

Who are the top shareholders of the Sukhjit Starch?

06-Jun-2025

The top shareholders of Sukhjit Starch include promoters, with Bhavdeep Sardana holding the largest individual stake at 8.06%. Individual investors own 27.2% of the shares, while foreign institutional investors have a negligible stake.

The top shareholders of Sukhjit Starch primarily consist of promoters, with Bhavdeep Sardana holding the highest individual stake at 8.06%. There are no pledged promoter holdings, and the company does not have any mutual fund schemes invested in it. Additionally, two foreign institutional investors (FIIs) hold shares, but their combined stake is negligible at 0.0%. Individual investors collectively hold 27.2% of the company's shares.

View full answer

What does Sukhjit Starch do?

06-Jun-2025

Sukhjit Starch & Chemicals Ltd manufactures maize starch and related products, operating as a Micro Cap company. As of March 2025, it reported net sales of ₹360 Cr and a net profit of ₹3 Cr.

Overview:<BR>Sukhjit Starch & Chemicals Ltd is engaged in the manufacturing of maize starch and related products, operating within the Other Agricultural Products industry and classified as a Micro Cap company.<BR><BR>History:<BR>Established in 1943 as a private limited company, Sukhjit Starch & Chemicals Ltd went public in 1944. The company was initially promoted by B K Sardana to set up a maize starch manufacturing plant. The latest quarterly results reported net sales and profit for March 2025.<BR><BR>Financial Snapshot:<BR>Net Sales: 360 Cr (Quarterly Results - Mar 2025) <BR>Net Profit: 3 Cr (Quarterly Results - Mar 2025) <BR>Market Cap: Rs 610 Cr (Micro Cap)<BR><BR>Key Metrics:<BR>P/E: 15.00 <BR>Industry P/E: 47 <BR>Dividend Yield: 0.00% <BR>Debt-Equity: 0.42 <BR>Return on Equity: 7.36% <BR>Price to Book: 1.08 <BR><BR>Contact Details:<BR>Address: Sarai Road, Phagwara Kapurthala Punjab : 144401 <BR>Tel: 91-1824-468800/260216/260314 <BR>Email: sukhjit@sukhjitgroup.com <BR>Website: http://www.sukhjitgroup.com

View full answer

What is the bonus history of the Sukhjit Starch?

06-Jun-2025

Sukhjit Starch has issued bonuses twice, with a 1:1 bonus announced on March 27, 2019, and another 1:1 bonus on November 8, 2006, demonstrating a consistent approach to rewarding shareholders.

Sukhjit Starch has a history of issuing bonuses, with two notable instances. The most recent bonus was a 1:1 issue announced on March 27, 2019, with a record date of March 28, 2019. Prior to that, the company also issued a 1:1 bonus on November 8, 2006, with a record date of November 10, 2006. This indicates a consistent approach to rewarding shareholders through bonus shares.

View full answer

Has Sukhjit Starch declared dividend?

06-Jun-2025

Sukhjit Starch & Chemicals Ltd has declared an 80% dividend, amounting to ₹8 per share, with an ex-date of January 15, 2024. Despite this dividend, recent total returns have been negative over the last 6 months and 1 year, though longer-term performance shows more favorable returns.

Sukhjit Starch & Chemicals Ltd has declared an 80% dividend.<BR><BR>Dividend Details:<BR>- Percentage announced: 80%<BR>- Amount per share: 8 per share<BR>- Ex-date: 15 Jan 24<BR><BR>Dividend Yield: 0%<BR><BR>Total Returns by Period:<BR>In the last 6 months, the price return was -33.96%, the dividend return was 0%, resulting in a total return of -33.96%.<BR><BR>Over the past year, the price return was -9.21%, with a dividend return of 0%, leading to a total return of -9.21%.<BR><BR>In the 2-year period, the price return was -8.14%, the dividend return was 3.68%, giving a total return of -4.46%.<BR><BR>For the 3-year period, the price return was -10.04%, the dividend return was 7.54%, resulting in a total return of -2.5%.<BR><BR>In the last 4 years, the price return was 74.87%, with a dividend return of 23.11%, culminating in a total return of 97.98%.<BR><BR>Finally, over the past 5 years, the price return was 125.8%, the dividend return was 36.88%, leading to a total return of 162.68%.<BR><BR>Overall, while Sukhjit Starch has declared a significant dividend, the recent total returns indicate a challenging performance in the short term, with negative returns over the last 6 months and 1 year, but a more favorable outlook over longer periods.

View full answer

Who are the peers of the Sukhjit Starch?

03-Jun-2025

Sukhjit Starch's peers include L T Foods, KRBL, Kaveri Seed Co., Guj. Ambuja Exp, GRM Overseas, Mangalam Global, Nath Bio-Genes, Aelea, Indo US Bio-Tech, and Tierra Agrotech. In terms of performance, Sukhjit Starch has a 1-year return of -13.25%, ranking higher than Guj. Ambuja Exp but lower than its other peers.

Peers: The peers of Sukhjit Starch are L T Foods, KRBL, Kaveri Seed Co., Guj. Ambuja Exp, GRM Overseas, Mangalam Global, Nath Bio-Genes, Aelea, Indo US Bio-Tech, and Tierra Agrotech.<BR><BR>Quality Snapshot: Excellent management risk is observed at Kaveri Seed Co. and Indo US Bio-Tech, while Good management risk is found at L T Foods and Sukhjit Starch. Average management risk is present at KRBL, Guj. Ambuja Exp, Aelea, and the rest. For Growth, Excellent growth is noted at Mangalam Global and Aelea, while Good growth is seen at L T Foods and Indo US Bio-Tech. Below Average growth is reported at KRBL, Kaveri Seed Co., Guj. Ambuja Exp, GRM Overseas, Sukhjit Starch, Nath Bio-Genes, and the rest. In terms of Capital Structure, Excellent capital structure is found at KRBL, Kaveri Seed Co., and Guj. Ambuja Exp, while Good capital structure is observed at Nath Bio-Genes, and Average capital structure is present at Sukhjit Starch, GRM Overseas, Mangalam Global, Aelea, and the rest.<BR><BR>Return Snapshot: The peer with the highest 1-year return is L T Foods at 111.87%, while the lowest is Guj. Ambuja Exp at -18.10%. Sukhjit Starch's 1-year return is -13.25%, which is higher than Guj. Ambuja Exp but lower than all other peers. Additionally, the six-month return is negative for Guj. Ambuja Exp, Sukhjit Starch, Mangalam Global, Aelea, Indo US Bio-Tech, and Tierra Agrotech.

View full answer

Is Sukhjit Starch overvalued or undervalued?

09-Jun-2025

As of May 30, 2025, Sukhjit Starch is considered very attractive and undervalued, with a PE ratio of 15.16, an EV to EBITDA of 7.48, and a Price to Book Value of 1.12, significantly lower than peers like Solar Industries and Godrej Industries, despite recent stock performance lagging behind the Sensex.

As of 30 May 2025, the valuation grade for Sukhjit Starch has moved from attractive to very attractive, indicating a significant improvement in its valuation outlook. The company is currently assessed as undervalued, supported by key ratios such as a PE ratio of 15.16, an EV to EBITDA of 7.48, and a Price to Book Value of 1.12. These metrics suggest that Sukhjit Starch is trading at a favorable valuation compared to its peers.<BR><BR>In comparison to its industry peers, Sukhjit Starch's PE ratio is notably lower than that of Solar Industries at 123.77 and Godrej Industries at 46.63, both categorized as very expensive. Additionally, Sukhjit Starch's EV to EBITDA of 7.48 is significantly more attractive than the industry average, reinforcing its undervalued status. While the company's recent stock performance has lagged behind the Sensex over various time frames, its long-term return of 248.63% over ten years highlights its potential for growth.

View full answer

Who are in the management team of Sukhjit Starch?

16-Jul-2025

As of March 2022, the management team of Sukhjit Starch includes K K Sardana (Managing Director), Aman Setia (Company Secretary), M G Sharma (CFO), and several independent directors, including Ranbir Singh Seehra and Vikas Uppal, among others, overseeing the company's operations and strategy.

As of March 2022, the management team of Sukhjit Starch includes the following individuals:<BR><BR>1. K K Sardana - Managing Director<BR>2. Aman Setia - Company Secretary & Compliance Officer<BR>3. M G Sharma - Director (Finance) & CFO<BR>4. Ranbir Singh Seehra - Independent Director<BR>5. Manjoo Sardana - Chairperson<BR>6. Vikas Uppal - Independent Director<BR>7. Shalini Chablani - Director<BR>8. Tarsem Singh Lally - Independent Director<BR>9. Saravjit Singh Hothi - Independent Director<BR><BR>This team is responsible for overseeing the company's operations and strategic direction.

View full answer

How big is Sukhjit Starch?

24-Jul-2025

As of 24th July, Sukhjit Starch & Chemicals Ltd has a market capitalization of 541.00 Cr, with recent net sales of 1497.95 Cr and a net profit of 39.95 Cr. The latest balance sheet shows shareholder's funds of 502.64 Cr and total assets of 1,021.70 Cr.

As of 24th July, Sukhjit Starch & Chemicals Ltd has a market capitalization of 541.00 Cr, categorizing it as a Micro Cap company.<BR><BR>For the latest four quarters, the company reported Net Sales of 1497.95 Cr and a Net Profit of 39.95 Cr.<BR><BR>The latest annual period for the balance sheet is March 2024, showing Shareholder's Funds of 502.64 Cr and Total Assets of 1,021.70 Cr.

View full answer

Is Sukhjit Starch technically bullish or bearish?

10-Nov-2025

As of November 7, 2025, the technical trend has shifted to a bearish stance with moderate strength, driven by bearish daily moving averages and indicators like Bollinger Bands and MACD, despite some mild bullishness in the weekly KST.

As of 7 November 2025, the technical trend has changed from mildly bearish to bearish. The current stance is bearish with moderate strength. Key indicators driving this include the daily moving averages which are bearish, and both the Bollinger Bands and MACD on the monthly timeframe indicating bearish conditions. The weekly KST shows mild bullishness, but overall, the bearish signals dominate. Additionally, the stock has underperformed significantly compared to the Sensex over various periods, reinforcing the bearish outlook.

View full answer

How has been the historical performance of Sukhjit Starch?

01-Dec-2025

Sukhjit Starch's historical performance shows increased net sales from 1,375.35 Cr in Mar'24 to 1,497.95 Cr in Mar'25, but profitability metrics declined, with profit after tax falling from 49.96 Cr to 39.95 Cr due to rising raw material costs and total expenditures. Overall, while sales grew, challenges in cost management impacted profitability.

Answer:<BR>The historical performance of Sukhjit Starch shows a fluctuating trend in key financial metrics over the years.<BR><BR>Breakdown:<BR>Sukhjit Starch's net sales increased from 1,375.35 Cr in Mar'24 to 1,497.95 Cr in Mar'25, reflecting a positive growth trend. However, the total operating income also saw a rise, reaching 1,497.95 Cr in Mar'25, up from 1,375.35 Cr in the previous year. The raw material cost surged to 1,140.33 Cr in Mar'25 from 966.43 Cr in Mar'24, contributing to a total expenditure of 1,386.26 Cr, which was higher than the 1,247.33 Cr recorded in Mar'24. Consequently, the operating profit (PBDIT) decreased to 111.69 Cr in Mar'25 from 128.02 Cr in Mar'24. Profit before tax also declined to 53.95 Cr in Mar'25 from 69.86 Cr in Mar'24, leading to a profit after tax of 39.95 Cr, down from 49.96 Cr. The earnings per share (EPS) fell to 12.79 in Mar'25 from 15.99 in Mar'24. On the balance sheet, total assets increased to 1,030.02 Cr in Mar'25 from 1,021.70 Cr in Mar'24, while total liabilities slightly rose to 1,030.02 Cr from 1,021.70 Cr. The cash flow from operating activities decreased to 67.00 Cr in Mar'25 from 77.00 Cr in Mar'24, indicating a decline in cash generation capabilities. Overall, while Sukhjit Starch experienced growth in sales, profitability metrics showed a downward trend, reflecting challenges in managing costs and expenses.

View full answer

When is the next results date for Sukhjit Starch & Chemicals Ltd?

05-Feb-2026

The next results date for Sukhjit Starch & Chemicals Ltd is 12 February 2026.

The next results date for Sukhjit Starch & Chemicals Ltd is scheduled for 12 February 2026.

View full answer

Are Sukhjit Starch & Chemicals Ltd latest results good or bad?

13-Feb-2026

Sukhjit Starch & Chemicals Ltd's latest results are poor, showing a 7.53% revenue decline and a 70.96% drop in net profit year-on-year, indicating significant operational challenges and margin compression. The company needs to address these issues to improve its financial performance.

The latest results for Sukhjit Starch & Chemicals Ltd indicate a challenging financial situation. In the December quarter, the company reported a revenue decline of 7.53% year-on-year, totaling ₹347.00 crores. Operating margins also contracted significantly, falling to 5.63% from 7.81% a year earlier. This resulted in a profit after tax margin of just 0.90%, down from 2.87% in the same quarter last year.<BR><BR>Net profit for the quarter was ₹3.13 crores, which represents a dramatic year-on-year decline of 70.96%. The nine-month performance for FY26 shows a substantial drop in net profit to ₹12.44 crores, down 66.52% from ₹37.15 crores in the previous year. This sustained weakness suggests that the company is facing structural challenges rather than temporary issues.<BR><BR>Overall, the results reflect severe margin compression and operational difficulties, leading to significant profitability pressures. Given these factors, the latest results can be characterized as bad, highlighting the need for the company to address its operational inefficiencies and cost pressures.

View full answer

Should I buy, sell or hold Sukhjit Starch & Chemicals Ltd?

27-Feb-2026

Why is Sukhjit Starch & Chemicals Ltd falling/rising?

04-Mar-2026

As of 04-Mar, Sukhjit Starch & Chemicals Ltd's stock price has declined to Rs 182.50, down 6.46%, and has underperformed its sector. The stock has seen reduced investor interest and is currently below its 5-day moving average, indicating short-term weakness.

As of 04-Mar, Sukhjit Starch & Chemicals Ltd is experiencing a decline in its stock price, currently at Rs 182.50, which represents a decrease of Rs 12.6 or 6.46%. This drop is part of a broader trend, as the stock has underperformed its sector by 5.93% today and has been on a consecutive decline for the last two days, accumulating a total loss of 15.72% during this period.<BR><BR>The stock opened significantly lower today, with a gap down of 5.07%, and reached an intraday low of Rs 182.50. Additionally, investor participation has decreased notably, with delivery volume falling by 77.36% compared to the 5-day average, indicating reduced interest from investors. Although the stock remains above its 20-day, 50-day, 100-day, and 200-day moving averages, it is currently below its 5-day moving average, suggesting a short-term weakness.<BR><BR>Overall, these factors contribute to the stock's decline, reflecting a challenging environment for Sukhjit Starch & Chemicals Ltd in the current market conditions.

View full answer
iScoreScore
Click here to find our call on this stock
Strong Sell
Sell
Hold
Buy
Strong Buy

Dashboard

1

Low ability to service debt as the company has a high Debt to EBITDA ratio of 2.52 times

  • Low ability to service debt as the company has a high Debt to EBITDA ratio of 2.52 times
2

Poor long term growth as Operating profit has grown by an annual rate 0.21% of over the last 5 years

 
3

The company has declared Negative results for the last 5 consecutive quarters

4

With ROCE of 5.4, it has a Attractive valuation with a 1 Enterprise value to Capital Employed

5

Despite the size of the company, domestic mutual funds hold only 0% of the company
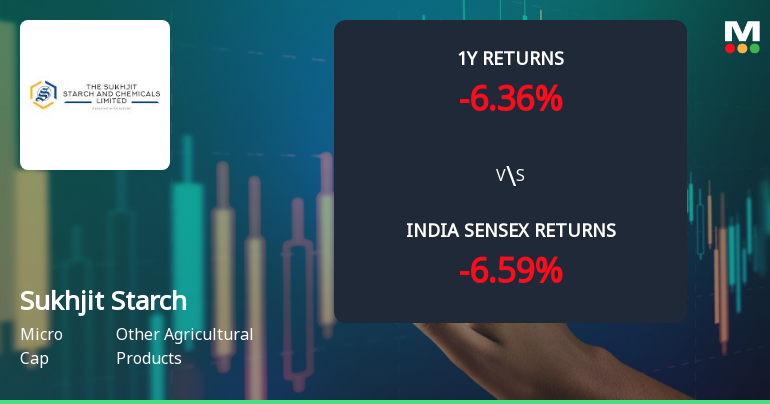
stock-summaryMojo Parameters

Mojo Parameters

Loading Valuation Snapshot...

Stock DNA

stock-summary
Industry

Other Agricultural Products

stock-summary
Market cap

INR 592 Cr (Micro Cap)

stock-summary
P/E

37.00

stock-summary
Industry P/E

38

stock-summary
Dividend Yield

0.55%

stock-summary
Debt Equity

0.58

stock-summary
Return on Equity

4.16%

stock-summary
Price to Book

1.04

Revenue and Profits:
Net Sales:
347 Cr
(Quarterly Results - Dec 2025)
Net Profit:
3 Cr
stock-summaryTotal Returns
Total Returns (Price + Dividend) stock-summary
Dividend Yield (0.55%)
TimePeriod
Price Return
Dividend Return
Total Return
3 Months
26.33%
0%
26.33%
6 Months
13.37%
0%
13.37%
1 Year
-1.46%
0.52%
-0.94%
2 Years
-19.8%
0.45%
-19.35%
3 Years
1.79%
4.76%
6.55%
4 Years
-15.15%
6.62%
-8.53%
5 Years
107.1%
29.84%
136.94%

Latest dividend: 1 per share ex-dividend date: Aug-20-2025

Risk Adjusted Returns v/s stock-summary
Returns Beta
Icon
Beta has not been calculated since enough price history is not available
stock-summaryNews & Corporate Actions

News

Sukhjit Starch & Chemicals Ltd Surges 27.42%: 3 Key Factors Driving the Rally

Announcements stock-summary

Clarification sought from Sukhjit Starch & Chemicals Ltd

02-Mar-2026 | Source : BSE

The Exchange has sought clarification from Sukhjit Starch & Chemicals Ltd on March 2 2026 with reference to significant movement in price in order to ensure that investors have latest relevant information about the company and to inform the market so that the interest of the investors is safeguarded.

The reply is awaited.

Announcement under Regulation 30 (LODR)-Press Release / Media Release

14-Feb-2026 | Source : BSE

Press Release

Announcement under Regulation 30 (LODR)-Newspaper Publication

14-Feb-2026 | Source : BSE

Newspapwe Publication

Corporate Actions stock-summary

stock-summary
BOARD MEETING

No Upcoming Board Meetings

stock-summary
DIVIDEND

Sukhjit Starch & Chemicals Ltd has declared 20% dividend, ex-date: 20 Aug 25

stock-summary
SPLITS

Sukhjit Starch & Chemicals Ltd has announced 5:10 stock split, ex-date: 25 Oct 24

stock-summary
BONUS

Sukhjit Starch & Chemicals Ltd has announced 1:1 bonus issue, ex-date: 27 Mar 19

stock-summary
RIGHTS

No Rights history available

stock-summaryKey Factors

Quality key factors stock-summary

Factor
Value
Sales Growth (5y)
16.63%
EBIT Growth (5y)
0.21%
EBIT to Interest (avg)
3.11
Debt to EBITDA (avg)
2.94
Net Debt to Equity (avg)
0.58
Sales to Capital Employed (avg)
1.57
Tax Ratio
21.89%
Dividend Payout Ratio
7.82%
Pledged Shares
0
Institutional Holding
0.02%
ROCE (avg)
12.49%
ROE (avg)
11.12%

Valuation key factors

Factor
Value
P/E Ratio
37
Industry P/E
38
Price to Book Value
1.04
EV to EBIT
24.13
EV to EBITDA
12.08
EV to Capital Employed
1.02
EV to Sales
0.64
PEG Ratio
NA
Dividend Yield
0.55%
ROCE (Latest)
5.39%
ROE (Latest)
4.16%

Technicals key factors

Indicator
Weekly
Monthly
MACD
Bullish
Mildly Bullish
RSI
No Signal
No Signal
Bollinger Bands
Mildly Bullish
Bearish
Moving Averages
Bullish (Daily)
KST
Bullish
Bearish
Dow Theory
No Trend
No Trend
OBV
No Trend
No Trend
stock-summary Technical Indicator Scale: Bearish, Mildly Bearish, Sideways, Mildly Bullish, Bullish  Turned 
stock-summaryShareholding
Shareholding Snapshot : Dec 2025stock-summary
Shareholding Compare (%holding) stock-summary
Majority shareholders

Promoters

Pledged Promoter Holdings

None

Mutual Funds

Held by 0 Schemes

FIIs

Held by 1 FIIs (0.02%)

Promoter with highest holding

Bhavdeep Sardana (8.06%)

Highest Public shareholder

None

Individual Investors Holdings

27.0%

stock-summaryFinancial
[
  {
    "link": "quarterly",
    "btn_text": "All Quarterly Results",
    "header": "Quarterly Results Snapshot (Consolidated) - Dec'25 - QoQ",
    "rhs": [
      {
        "prefix": "Net Sales ",
        "suffix": "QoQ Growth in quarter ended Dec 2025 is 10.30% vs -14.77% in Sep 2025",
        "dir": 1
      },
      {
        "prefix": "Consolidated Net Profit ",
        "suffix": "QoQ Growth in quarter ended Dec 2025 is -27.21% vs -14.17% in Sep 2025",
        "dir": -1
      }
    ],
    "table": {
      "header": [
        "Dec'25",
        "Sep'25",
        "Change(%)"
      ],
      "body": [
        {
          "field": "Net Sales",
          "val1": "347.00",
          "val2": "314.61",
          "chgp": "10.30%",
          "chgp_class": "positive"
        },
        {
          "field": "Operating Profit (PBDIT) excl Other Income",
          "val1": "19.53",
          "val2": "18.21",
          "chgp": "7.25%",
          "chgp_class": "positive"
        },
        {
          "field": "Interest",
          "val1": "8.02",
          "val2": "8.84",
          "chgp": "-9.28%",
          "chgp_class": "positive"
        },
        {
          "field": "Exceptional Items",
          "val1": "0.00",
          "val2": "0.00",
          "chgp": "",
          "chgp_class": "neutral"
        },
        {
          "field": "Consolidate Net Profit",
          "val1": "3.13",
          "val2": "4.30",
          "chgp": "-27.21%",
          "chgp_class": "negative"
        },
        {
          "field": "Operating Profit Margin (Excl OI)",
          "val1": "5.63%",
          "val2": "5.79%",
          "chgp": "-0.16%",
          "chgp_class": "negative"
        }
      ]
    }
  },
  {
    "link": "half-yearly",
    "btn_text": "All Half Yearly Results",
    "header": "Half Yearly Results Snapshot (Consolidated) - Sep'25",
    "rhs": [
      {
        "prefix": "Net Sales ",
        "suffix": " Growth in half year ended Sep 2025 is -10.38% vs 18.46% in Sep 2024",
        "dir": -1
      },
      {
        "prefix": "Consolidated Net Profit ",
        "suffix": " Growth in half year ended Sep 2025 is -64.69% vs 19.54% in Sep 2024",
        "dir": -1
      }
    ],
    "table": {
      "header": [
        "Sep'25",
        "Sep'24",
        "Change(%)"
      ],
      "body": [
        {
          "field": "Net Sales",
          "val1": "683.74",
          "val2": "762.94",
          "chgp": "-10.38%",
          "chgp_class": "negative"
        },
        {
          "field": "Operating Profit (PBDIT) excl Other Income",
          "val1": "37.25",
          "val2": "65.47",
          "chgp": "-43.10%",
          "chgp_class": "negative"
        },
        {
          "field": "Interest",
          "val1": "16.11",
          "val2": "16.29",
          "chgp": "-1.10%",
          "chgp_class": "positive"
        },
        {
          "field": "Exceptional Items",
          "val1": "0.00",
          "val2": "0.00",
          "chgp": "",
          "chgp_class": "neutral"
        },
        {
          "field": "Consolidate Net Profit",
          "val1": "9.31",
          "val2": "26.37",
          "chgp": "-64.69%",
          "chgp_class": "negative"
        },
        {
          "field": "Operating Profit Margin (Excl OI)",
          "val1": "5.45%",
          "val2": "8.58%",
          "chgp": "-3.13%",
          "chgp_class": "negative"
        }
      ]
    }
  },
  {
    "link": "nine-monthly",
    "btn_text": "All Nine Monthly Results",
    "header": "Nine Monthly Results Snapshot (Consolidated) - Dec'25",
    "rhs": [
      {
        "prefix": "Net Sales ",
        "suffix": "YoY Growth in nine months ended Dec 2025 is -9.44% vs 13.21% in Dec 2024",
        "dir": -1
      },
      {
        "prefix": "Consolidated Net Profit ",
        "suffix": "YoY Growth in nine months ended Dec 2025 is -66.51% vs -2.44% in Dec 2024",
        "dir": -1
      }
    ],
    "table": {
      "header": [
        "Dec'25",
        "Dec'24",
        "Change(%)"
      ],
      "body": [
        {
          "field": "Net Sales",
          "val1": "1,030.74",
          "val2": "1,138.20",
          "chgp": "-9.44%",
          "chgp_class": "negative"
        },
        {
          "field": "Operating Profit (PBDIT) excl Other Income",
          "val1": "56.78",
          "val2": "94.77",
          "chgp": "-40.09%",
          "chgp_class": "negative"
        },
        {
          "field": "Interest",
          "val1": "24.13",
          "val2": "24.15",
          "chgp": "-0.08%",
          "chgp_class": "positive"
        },
        {
          "field": "Exceptional Items",
          "val1": "0.00",
          "val2": "0.00",
          "chgp": "",
          "chgp_class": "neutral"
        },
        {
          "field": "Consolidate Net Profit",
          "val1": "12.44",
          "val2": "37.15",
          "chgp": "-66.51%",
          "chgp_class": "negative"
        },
        {
          "field": "Operating Profit Margin (Excl OI)",
          "val1": "5.51%",
          "val2": "8.33%",
          "chgp": "-2.82%",
          "chgp_class": "negative"
        }
      ]
    }
  },
  {
    "link": "annual",
    "btn_text": "All Annual Results",
    "header": "Annual Results Snapshot (Consolidated) - Mar'25",
    "rhs": [
      {
        "prefix": "Net Sales ",
        "suffix": "YoY Growth in year ended Mar 2025 is 8.91% vs -4.92% in Mar 2024",
        "dir": 1
      },
      {
        "prefix": "Consolidated Net Profit ",
        "suffix": "YoY Growth in year ended Mar 2025 is -20.04% vs -21.16% in Mar 2024",
        "dir": 1
      }
    ],
    "table": {
      "header": [
        "Mar'25",
        "Mar'24",
        "Change(%)"
      ],
      "body": [
        {
          "field": "Net Sales",
          "val1": "1,497.95",
          "val2": "1,375.35",
          "chgp": "8.91%",
          "chgp_class": "positive"
        },
        {
          "field": "Operating Profit (PBDIT) excl Other Income",
          "val1": "111.69",
          "val2": "128.02",
          "chgp": "-12.76%",
          "chgp_class": "negative"
        },
        {
          "field": "Interest",
          "val1": "30.08",
          "val2": "33.02",
          "chgp": "-8.90%",
          "chgp_class": "positive"
        },
        {
          "field": "Exceptional Items",
          "val1": "0.00",
          "val2": "0.00",
          "chgp": "",
          "chgp_class": "neutral"
        },
        {
          "field": "Consolidate Net Profit",
          "val1": "39.95",
          "val2": "49.96",
          "chgp": "-20.04%",
          "chgp_class": "negative"
        },
        {
          "field": "Operating Profit Margin (Excl OI)",
          "val1": "7.46%",
          "val2": "9.31%",
          "chgp": "-1.85%",
          "chgp_class": "negative"
        }
      ]
    }
  }
]

Quarterly Results Snapshot (Consolidated) - Dec'25 - QoQstock-summary

Dec'25
Sep'25
Change(%)
Net Sales
347.00
314.61
10.30%
Operating Profit (PBDIT) excl Other Income
19.53
18.21
7.25%
Interest
8.02
8.84
-9.28%
Exceptional Items
0.00
0.00
Consolidate Net Profit
3.13
4.30
-27.21%
Operating Profit Margin (Excl OI)
5.63%
5.79%
-0.16%
Values in Rs Cr.
Direction Arrows
Net Sales

QoQ Growth in quarter ended Dec 2025 is 10.30% vs -14.77% in Sep 2025

Direction Arrows
Consolidated Net Profit

QoQ Growth in quarter ended Dec 2025 is -27.21% vs -14.17% in Sep 2025

Half Yearly Results Snapshot (Consolidated) - Sep'25stock-summary

Sep'25
Sep'24
Change(%)
Net Sales
683.74
762.94
-10.38%
Operating Profit (PBDIT) excl Other Income
37.25
65.47
-43.10%
Interest
16.11
16.29
-1.10%
Exceptional Items
0.00
0.00
Consolidate Net Profit
9.31
26.37
-64.69%
Operating Profit Margin (Excl OI)
5.45%
8.58%
-3.13%
Values in Rs Cr.
Direction Arrows
Net Sales

Growth in half year ended Sep 2025 is -10.38% vs 18.46% in Sep 2024

Direction Arrows
Consolidated Net Profit

Growth in half year ended Sep 2025 is -64.69% vs 19.54% in Sep 2024

Nine Monthly Results Snapshot (Consolidated) - Dec'25stock-summary

Dec'25
Dec'24
Change(%)
Net Sales
1,030.74
1,138.20
-9.44%
Operating Profit (PBDIT) excl Other Income
56.78
94.77
-40.09%
Interest
24.13
24.15
-0.08%
Exceptional Items
0.00
0.00
Consolidate Net Profit
12.44
37.15
-66.51%
Operating Profit Margin (Excl OI)
5.51%
8.33%
-2.82%
Values in Rs Cr.
Direction Arrows
Net Sales

YoY Growth in nine months ended Dec 2025 is -9.44% vs 13.21% in Dec 2024

Direction Arrows
Consolidated Net Profit

YoY Growth in nine months ended Dec 2025 is -66.51% vs -2.44% in Dec 2024

Annual Results Snapshot (Consolidated) - Mar'25stock-summary

Mar'25
Mar'24
Change(%)
Net Sales
1,497.95
1,375.35
8.91%
Operating Profit (PBDIT) excl Other Income
111.69
128.02
-12.76%
Interest
30.08
33.02
-8.90%
Exceptional Items
0.00
0.00
Consolidate Net Profit
39.95
49.96
-20.04%
Operating Profit Margin (Excl OI)
7.46%
9.31%
-1.85%
Values in Rs Cr.
Direction Arrows
Net Sales

YoY Growth in year ended Mar 2025 is 8.91% vs -4.92% in Mar 2024

Direction Arrows
Consolidated Net Profit

YoY Growth in year ended Mar 2025 is -20.04% vs -21.16% in Mar 2024

stock-summaryCompany CV
About Sukhjit Starch & Chemicals Ltd stock-summary
stock-summary
Sukhjit Starch & Chemicals Ltd
Micro Cap
Other Agricultural Products
Established as a private limited company in 1943, Sukhjit Starch & Chemicals Limited (SSCL) went public in 1944. It was originally promoted by B K Sardana, to set up a maize starch manufacturing plant with an installed capacity of 5 tpd at Phagwara, Punjab. Its capacity was expanded to 35 TPD by 1960. SSCL commissioned a 100% indigenous liquid glucose plant in 1967 and added a dextrose monohydrate facility in 1982.
Company Coordinates stock-summary
Company Details
Sarai Road, Phagwara Kapurthala Punjab : 144401
stock-summary
Tel: 91-1824-468800/260216/260314
stock-summary
sukhjit@sukhjitgroup.com
Registrar Details
Skyline Financial Services Pvt Ltd , D-153/A, 1st Floor, Okhla Industrial Area, Phase - I, New Delhi