
Compare Sulabh Engineers with Similar Stocks
Stock DNA
Non Banking Financial Company (NBFC)
INR 28 Cr (Micro Cap)
20.00
20
0.00%
0.00
3.80%
0.75
Total Returns (Price + Dividend) 
Sulabh Engineers for the last several years.
Risk Adjusted Returns v/s
Returns Beta

News
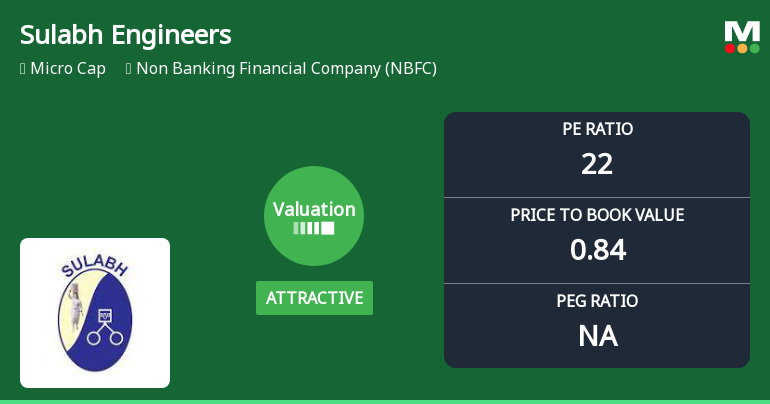
Sulabh Engineers & Services Ltd: Valuation Shifts Signal Renewed Price Attractiveness
Sulabh Engineers & Services Ltd, a micro-cap player in the Non Banking Financial Company (NBFC) sector, has witnessed a notable shift in its valuation parameters, moving from a very attractive to an attractive rating. This change reflects evolving market perceptions and offers investors a fresh perspective on the stock’s price appeal amid mixed performance metrics and sector dynamics.
Read full news article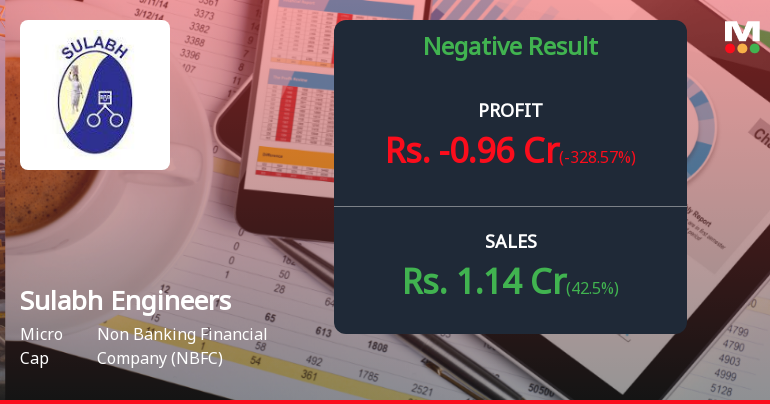
Sulabh Engineers Q4 FY26: Sharp Quarterly Loss Raises Serious Concerns Despite Full-Year Turnaround
Sulabh Engineers & Services Ltd., a Mumbai-based non-banking financial company, reported a consolidated net loss of ₹0.96 crores for Q4 FY26 (March 2026 quarter), marking a dramatic reversal from the ₹1.14 crores profit recorded in Q3 FY26 and a steep 328.57% year-on-year decline from the ₹0.42 crores profit in Q4 FY25. The micro-cap NBFC, with a market capitalisation of ₹32.00 crores, saw its stock price edge up 1.97% to ₹3.10 on May 29, 2026, despite the concerning quarterly results.
Read full news article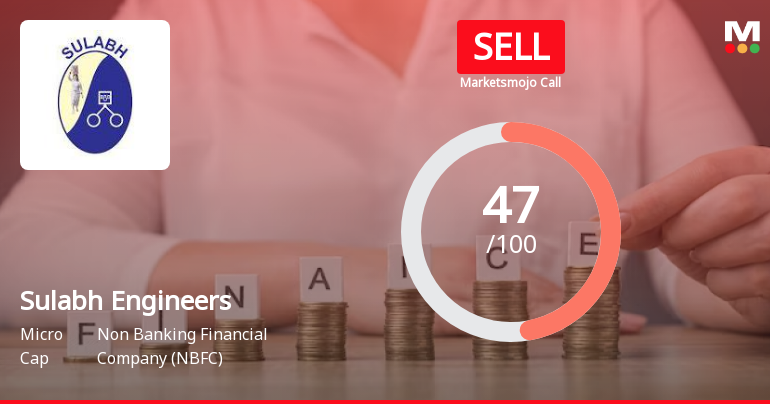
Sulabh Engineers & Services Ltd is Rated Sell
Sulabh Engineers & Services Ltd is rated 'Sell' by MarketsMOJO, with this rating last updated on 06 Apr 2026. However, the analysis and financial metrics discussed here reflect the stock's current position as of 28 May 2026, providing investors with an up-to-date view of the company’s fundamentals, valuation, financial trends, and technical outlook.
Read full news article Announcements
Announcement under Regulation 30 (LODR)-Newspaper Publication
30-May-2026 | Source : BSENewspaper Publication
Financial Results For The Quarter/Year Ended On 31.03.2026
29-May-2026 | Source : BSEFinancial results for the quarter/year ended on 31.03.2026
Board Meeting Outcome for Outcome Of The Board Meeting Held On 29.05.20256
29-May-2026 | Source : BSEOutcome of the board meeting held on 29.05.2026
Corporate Actions

No Upcoming Board Meetings

Sulabh Engineers & Services Ltd has declared 6% dividend, ex-date: 29 Jun 10

Sulabh Engineers & Services Ltd has announced 1:10 stock split, ex-date: 04 Feb 13

No Bonus history available

No Rights history available
Quality key factors
Valuation key factors
Technicals key factors
 Technical Indicator Scale: Bearish, Mildly Bearish, Sideways, Mildly Bullish, Bullish Turned
 Shareholding Snapshot : Mar 2026
Shareholding Compare (%holding)
Non Institution
None
Held by 0 Schemes
Held by 0 FIIs
Ruchi Agarwal (5.79%)
Som Prakash Goenka (3.87%)
55.66%
Quarterly Results Snapshot (Consolidated) - Mar'26 - YoY

YoY Growth in quarter ended Mar 2026 is 42.50% vs 139.22% in Mar 2025
YoY Growth in quarter ended Mar 2026 is -328.57% vs -19.23% in Mar 2025
Half Yearly Results Snapshot (Consolidated) - Sep'25
Growth in half year ended Sep 2025 is -37.68% vs 11.29% in Sep 2024

Growth in half year ended Sep 2025 is 110.53% vs 83.87% in Sep 2024
Nine Monthly Results Snapshot (Consolidated) - Dec'25
YoY Growth in nine months ended Dec 2025 is -33.49% vs -20.19% in Dec 2024
YoY Growth in nine months ended Dec 2025 is 68.35% vs 117.19% in Dec 2024
Annual Results Snapshot (Consolidated) - Mar'26
YoY Growth in year ended Mar 2026 is -21.21% vs 56.65% in Mar 2025
YoY Growth in year ended Mar 2026 is -64.63% vs 73.24% in Mar 2025
About Sulabh Engineers & Services Ltd

Company Coordinates


