
Compare Sumitomo Electric Industries Ltd. with Similar Stocks
Dashboard
The company has declared Positive results for the last 6 consecutive quarters
- DEBT-EQUITY RATIO (HY) Lowest at 18.25 %
- DEBTORS TURNOVER RATIO(HY) Highest at 5.51%
- RAW MATERIAL COST(Y) Fallen by -5.71% (YoY)
With ROCE of 11.95%, it has a very attractive valuation with a 1.02 Enterprise value to Capital Employed
Market Beating performance in long term as well as near term
Stock DNA
Electronics & Appliances
JPY 3,286,914 Million (Large Cap)
10.00
NA
0.01%
0.18
10.37%
1.44
Total Returns (Price + Dividend) 
Sumitomo Electric Industries Ltd. for the last several years.
Risk Adjusted Returns v/s
News
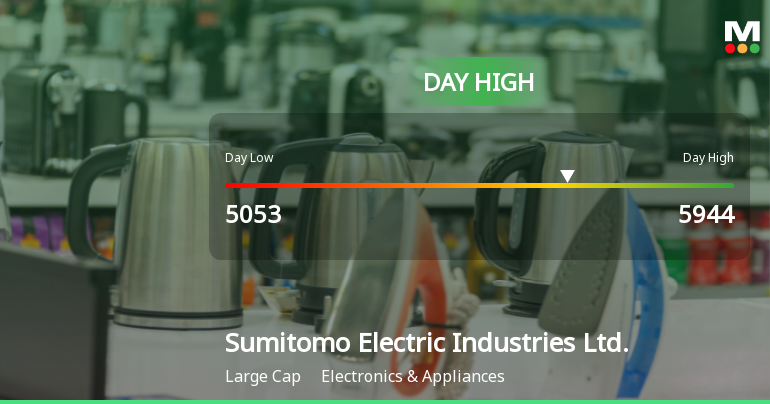
Sumitomo Electric Industries Hits Day High with 6.62% Surge in Stock Price
Sumitomo Electric Industries has seen notable stock performance, gaining 6.62% on October 31, 2025, and achieving an intraday high of JPY 5,944.00. With a market capitalization of JPY 3,286,914 million and a low debt-equity ratio of 0.18, the company reflects strong financial health and consistent profitability.
Read full news article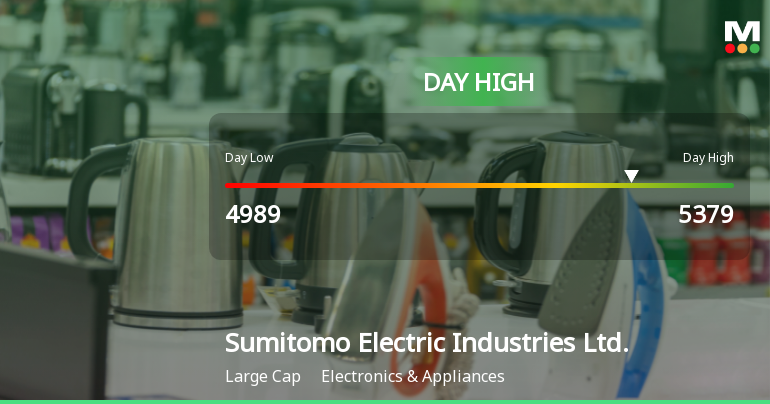
Sumitomo Electric Industries Hits Day High with 11.37% Surge
Sumitomo Electric Industries has seen notable stock activity, achieving an intraday high and significant weekly and monthly gains. The company has demonstrated strong long-term growth, outperforming the Nikkei 225. Financial metrics reveal a solid position, with consistent positive results and a substantial market capitalization in the electronics sector.
Read full news article
Sumitomo Electric Industries Hits Day High with 4.7% Surge in Stock Price
Sumitomo Electric Industries has seen significant stock performance, with a notable increase today and impressive gains over the past week and month. The company has delivered strong annual returns, outpacing the Japan Nikkei 225, and maintains a solid financial position with favorable metrics in debt and valuation.
Read full news article Announcements

Corporate Actions
Quality key factors
Valuation key factors
Technicals key factors
 Technical Indicator Scale: Bearish, Mildly Bearish, Sideways, Mildly Bullish, Bullish Turned
 Shareholding Snapshot : Mar 2025
Shareholding Compare (%holding)
Foreign Institutions
Held in 0 Schemes (0%)
Held by 2 Foreign Institutions (0.07%)
Quarterly Results Snapshot (Consolidated) - Jun'25 - YoY

YoY Growth in quarter ended Jun 2025 is 2.95% vs 12.21% in Jun 2024
YoY Growth in quarter ended Jun 2025 is 9.87% vs 699.42% in Jun 2024
Annual Results Snapshot (Consolidated) - Mar'25
YoY Growth in year ended Mar 2025 is 6.29% vs 9.92% in Mar 2024

YoY Growth in year ended Mar 2025 is 31.29% vs 27.74% in Mar 2024
About Sumitomo Electric Industries Ltd.

Company Coordinates


