
Compare Sumitomo Mitsui Financial Group, Inc. with Similar Stocks
Stock DNA
Major Banks
JPY 21,701,775 Million (Large Cap)
12.00
NA
0.00%
0.00
7.77%
1.43
Revenue and Profits:
Net Sales:
1,712,446 Million
(Quarterly Results - Jun 2025)
Net Profit:
379,331 Million
Total Returns (Price + Dividend) 
TimePeriod
Price Return
Dividend Return
Total Return
3 Months
23112.88%
0%
23112.88%
6 Months
22851.46%
0%
22851.46%
1 Year
16248.55%
0%
16248.55%
2 Years
15568.08%
0%
15568.08%
3 Years
14824.24%
0%
14824.24%
4 Years
17771.18%
0%
17771.18%
5 Years
14767.92%
0%
14767.92%
Sumitomo Mitsui Financial Group, Inc. for the last several years.
Risk Adjusted Returns v/s
News
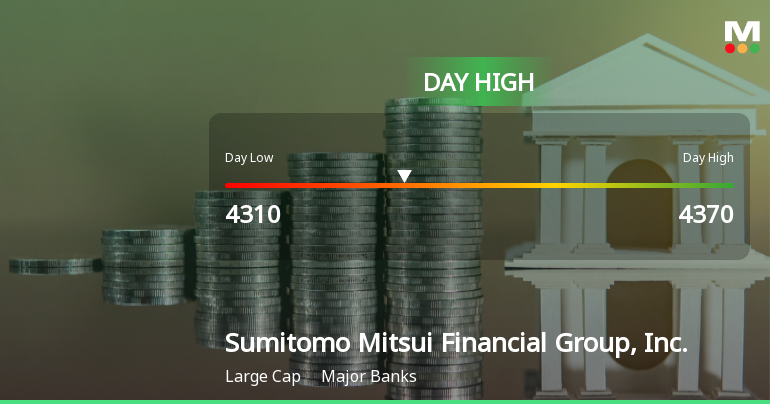
Sumitomo Mitsui Financial Group Hits Day High with 3.17% Surge
Sumitomo Mitsui Financial Group, Inc. has experienced notable stock performance, outperforming the Japan Nikkei 225 over the past week and month. The company reported strong financial metrics, including a return on equity of 8.14% and a market capitalization of JPY 15,864,075 million, highlighting its position in the banking sector.
Read full news article Announcements

No announcement available
Corporate Actions
No corporate action available
Quality key factors
Factor
Value
Sales Growth (5y)
22.70%
EBIT Growth (5y)
11.56%
EBIT to Interest (avg)
0
Debt to EBITDA (avg)
0
Net Debt to Equity (avg)
0
Sales to Capital Employed (avg)
0
Tax Ratio
0
Dividend Payout Ratio
40.46%
Pledged Shares
0
Institutional Holding
0.00%
ROCE (avg)
0
ROE (avg)
0
Valuation key factors
Factor
Value
P/E Ratio
12
Industry P/E
Price to Book Value
0.95
EV to EBIT
-6.55
EV to EBITDA
-5.38
EV to Capital Employed
1.10
EV to Sales
-1.22
PEG Ratio
NA
Dividend Yield
NA
ROCE (Latest)
-16.73%
ROE (Latest)
8.01%
Technicals key factors
Indicator
Weekly
Monthly
MACD
Bullish
Bullish
RSI
Bearish
Bearish
Bollinger Bands
Bullish
Bullish
Moving Averages
Bullish (Daily)
KST
Bullish
Bullish
Dow Theory
No Trend
Mildly Bullish
OBV
Mildly Bullish
Mildly Bullish
 Technical Indicator Scale: Bearish, Mildly Bearish, Sideways, Mildly Bullish, Bullish Turned
 Shareholding Snapshot : Sep 2025
Shareholding Compare (%holding)
Majority shareholders
Foreign Institutions
Domestic Funds
Held in 0 Schemes (0%)
Foreign Institutions
Held by 4 Foreign Institutions (0.0%)
Strategic Entities with highest holding
Highest Public shareholder
About Sumitomo Mitsui Financial Group, Inc.

Sumitomo Mitsui Financial Group, Inc.
Major Banks
No Details Available.
Company Coordinates
No Company Details Available
InfinHub Market Technologies FZ-LLC, Building-2, Unit 112, Dubai Internet City, Dubai, United Arab Emirates
GET THE MARKETSMOJO APP


Company
Stocks
Portfolio


"Investment in securities markets are subject to market risk. Read all the related documents carefully before investing."