Sumuka Agro

  • Market Cap: Micro Cap
  • Industry: FMCG
  • ISIN: INE311N01016
  • NSEID:
  • BSEID: 532070
INR
154.95
-2.9 (-1.84%)
BSENSE

May 29

BSE+NSE Vol: 32.5 k

  • Price Points
  • Score
  • Mojo Parameters
  • Total Return
  • News and Corporate Actions
  • Key factors
  • Shareholding
  • Financials
  • CompanyCV
stock-recommendationUpcoming Result: Sumuka Agro will declare its result soon on 30 May 2026
stock-summaryPrice Point
High/Low

1Day

52 Week

Valuation
Technical
Day's Volume

CASH

32.5 k (-22.27%) Volume

Shareholding (Mar 2026)

FII

4.38%

Held by 2 FIIs

DII

0.84%

Held by 0 DIIs

Promoter

63.75%

What is the technical trend for Sumuka Agro?

09-Jun-2025

As of June 6, 2025, Sumuka Agro's technical trend is bullish, supported by weekly MACD and Bollinger Bands, though caution is advised due to mixed signals from monthly RSI and KST.

As of 6 June 2025, the technical trend for Sumuka Agro has changed from mildly bullish to bullish. The weekly MACD and Bollinger Bands are both indicating a bullish stance, supporting the upward momentum. Daily moving averages also confirm a bullish trend. However, the monthly RSI shows a bearish signal, and the KST is mildly bearish on a monthly basis, suggesting some caution. The Dow Theory indicates a mildly bearish stance on the weekly chart, but there is no clear trend on the monthly chart. Overall, the current technical stance is bullish, but with some mixed signals, particularly on the monthly indicators.

View full answer

Is Sumuka Agro overvalued or undervalued?

09-Jun-2025

As of April 21, 2025, Sumuka Agro is considered very expensive and overvalued with a PE ratio of 56.48 and an EV to EBITDA of 45.64, significantly higher than its peers like JK Paper and West Coast Paper, despite a one-year stock return of 70.98% compared to the Sensex's 7.65%.

As of 21 April 2025, the valuation grade for Sumuka Agro has moved from expensive to very expensive, indicating a significant increase in perceived valuation. The company is currently considered overvalued. Key ratios include a PE ratio of 56.48, an EV to EBITDA of 45.64, and a Price to Book Value of 12.13, all of which are substantially higher than industry norms.<BR><BR>In comparison to its peers, Sumuka Agro's valuation metrics are starkly elevated; for instance, JK Paper has a PE ratio of 15.48 and an EV to EBITDA of 8.36, while West Coast Paper shows a PE of 10.55 and an EV to EBITDA of 5.21. This stark contrast highlights the overvaluation of Sumuka Agro. Additionally, the company's stock has significantly outperformed the Sensex, with a one-year return of 70.98% compared to the Sensex's 7.65%, further emphasizing the disconnect between its high valuation and market performance.

View full answer

Who are the top shareholders of the Sumuka Agro?

06-Jun-2025

The top shareholders of Sumuka Agro include promoter Vishal Vipinbhai Bhatt with 8.81%, public shareholder Aegis Investment Fund Pcc at 7.6%, and foreign institutional investors holding a combined 12.89%. Individual investors own 46.83%, with no pledged promoter holdings or mutual fund investments.

The top shareholders of Sumuka Agro include Vishal Vipinbhai Bhatt, who is the promoter with the highest holding at 8.81%. The highest public shareholder is Aegis Investment Fund Pcc, holding 7.6%. Additionally, foreign institutional investors (FIIs) hold a combined 12.89% through two FIIs. Individual investors collectively own 46.83% of the company. There are no pledged promoter holdings, and no mutual funds are currently invested in the company.

View full answer

Who are in the management team of Sumuka Agro?

06-Jun-2025

As of March 2023, the management team of Sumuka Agro includes Paresh Thakker (Chairman & Managing Director), Shaili Vijaybhai Patel (Executive Director & CFO), Bhavin Harshadbhai Mehta (Non Executive Director), Shilpa M (Executive Director), and independent directors Amitkumar Rathi, Sunil Swami, and Mangina Srinivas Rao. Each member contributes to the company's governance and operational oversight.

As of March 2023, the management team of Sumuka Agro includes the following individuals:<BR><BR>1. **Paresh Thakker** - Chairman & Managing Director<BR>2. **Shaili Vijaybhai Patel** - Executive Director & CFO<BR>3. **Bhavin Harshadbhai Mehta** - Non Executive Director<BR>4. **Shilpa M** - Executive Director<BR>5. **Amitkumar Rathi** - Independent Non Executive Director<BR>6. **Sunil Swami** - Independent Non Executive Director<BR>7. **Mangina Srinivas Rao** - Additional Independent Director<BR><BR>Each member plays a distinct role in the governance and operational oversight of the company.

View full answer

Has Sumuka Agro declared dividend?

06-Jun-2025

No Dividend History Available

Who are the peers of the Sumuka Agro?

03-Jun-2025

Sumuka Agro's peers include Hind. Unilever, ITC, Nestle India, Britannia Inds., Godrej Consumer, Umang Dairies, Ganges Securitie, Zeal Aqua, and Srivari Spices. Sumuka Agro shows good growth and management risk, with the highest 1-year return at 60.10%, outperforming all its peers.

Peers: The peers of Sumuka Agro are Hind. Unilever, ITC, Nestle India, Britannia Inds., Godrej Consumer, Umang Dairies, Ganges Securitie, Zeal Aqua, and Srivari Spices.<BR><BR>Quality Snapshot: Excellent management risk is observed at ITC, Nestle India, and Britannia Inds., while Good management risk is found at Hind. Unilever, Godrej Consumer, Sumuka Agro, and Srivari Spices. Average management risk is present at Umang Dairies, while Below Average management risk is noted for Ganges Securitie and Zeal Aqua. In terms of Growth, Excellent growth is seen at Srivari Spices, Good growth is reported by Sumuka Agro, while Average growth is noted at Nestle India, and Below Average growth is found at Hind. Unilever, ITC, Britannia Inds., Godrej Consumer, and Umang Dairies, with the rest showing Below Average growth as well. Capital Structure ratings are Excellent for Hind. Unilever, ITC, Nestle India, Britannia Inds., Godrej Consumer, and Ganges Securitie, while Good is noted for Sumuka Agro, Average for Srivari Spices, and Below Average for Umang Dairies and Zeal Aqua.<BR><BR>Return Snapshot: Sumuka Agro has the highest 1-year return at 60.10%, while Umang Dairies has the lowest at -13.29%. Sumuka Agro's return significantly outperforms all peers. Additionally, Ganges Securitie and Umang Dairies have negative six-month returns.

View full answer

What does Sumuka Agro do?

17-Jul-2025

Sumuka Agro Industries Ltd manufactures machinery for the paper industry and operates in the FMCG sector. As of March 2025, it reported net sales of ₹175 Cr and a net profit of ₹7 Cr, with a market cap of ₹157 Cr.

Overview:<BR>Sumuka Agro Industries Ltd is engaged in the manufacturing and dealing of machinery for the paper industry and operates within the FMCG sector, classified as a micro-cap company.<BR><BR>History:<BR>Incorporated in June 1989, the company was formerly known as Superb Papers Limited and changed its name to Sumuka Agro Industries Limited on September 15, 2016. The latest quarterly results reported net sales and net profit for the period ending March 2025.<BR><BR>Financial Snapshot:<BR>Net Sales: 175 Cr (Quarterly Results - Mar 2025) <BR>Net Profit: 7 Cr (Quarterly Results - Mar 2025) <BR>Market Cap: INR 157 Cr (Micro Cap)<BR><BR>Key Metrics:<BR>P/E: 49.00 <BR>Industry P/E: 15 <BR>Dividend Yield: 0.00% <BR>Debt-Equity: 0.03 <BR>Return on Equity: 21.47% <BR>Price to Book: 10.77 <BR><BR>Contact Details:<BR>Address: Shop No 1& 7 Ground Floor, Empress Chamber Kandivali (W) Mumbai Maharashtra : 400067 <BR>Email: sumukaagro@gmail.com <BR>Website: http://www.sumukaagro.com

View full answer

How big is Sumuka Agro?

24-Jul-2025

As of 24th July, Sumuka Agro Industries Ltd has a market capitalization of 166.00 Cr, with recent net sales of 62.30 Cr and a net profit of 3.19 Cr. Shareholder's funds are 13.42 Cr, and total assets are valued at 25.18 Cr.

As of 24th July, Sumuka Agro Industries Ltd has a market capitalization of 166.00 Cr, categorizing it as a Micro Cap company.<BR><BR>In the latest four quarters, Sumuka Agro reported Net Sales of 62.30 Cr and a Net Profit of 3.19 Cr.<BR><BR>The latest annual period for the balance sheet is March 2024, with Shareholder's Funds amounting to 13.42 Cr and Total Assets valued at 25.18 Cr.

View full answer

How has been the historical performance of Sumuka Agro?

12-Nov-2025

Sumuka Agro has experienced significant growth in net sales, increasing from 1.39 Cr in March 2022 to 62.30 Cr in March 2025, while profitability metrics have shown volatility, with profit after tax declining from 4.26 Cr in March 2024 to 2.74 Cr in March 2025. Despite rising total liabilities, shareholder's funds improved from 9.17 Cr to 13.42 Cr during the same period.

Answer:<BR>The historical performance of Sumuka Agro shows significant growth in net sales and profitability over the years.<BR><BR>Breakdown:<BR>Sumuka Agro's net sales have increased dramatically from 1.39 Cr in March 2022 to 62.30 Cr in March 2025, reflecting a strong upward trend. The total operating income followed a similar trajectory, rising from 1.39 Cr in March 2022 to 62.30 Cr in March 2025. The company's operating profit (PBDIT) also saw growth, reaching 4.08 Cr in March 2025, although it was lower than the previous year's 7.04 Cr. Profit before tax peaked at 5.38 Cr in March 2024 but decreased to 3.66 Cr in March 2025, while profit after tax showed a similar pattern, declining from 4.26 Cr in March 2024 to 2.74 Cr in March 2025. The company's total liabilities increased from 19.86 Cr in March 2023 to 25.18 Cr in March 2024, indicating a rise in financial obligations. Despite these increases in liabilities, shareholder's funds grew from 9.17 Cr in March 2023 to 13.42 Cr in March 2024, showcasing improved equity. Cash flow from operating activities remained negative, indicating challenges in cash generation, with a cash flow of -2.00 Cr in March 2024. Overall, Sumuka Agro has demonstrated substantial growth in sales and equity, although profitability metrics have shown some volatility in recent years.

View full answer

How has been the historical performance of Sumuka Agro?

12-Nov-2025

Sumuka Agro has experienced significant growth in net sales, rising from 1.39 Cr in March 2022 to 62.30 Cr in March 2025, but recent trends show volatility in profit margins and negative cash flow despite increased profitability. Operating profit peaked at 7.04 Cr in March 2024 before declining to 4.08 Cr in March 2025.

Answer:<BR>The historical performance of Sumuka Agro shows significant growth in net sales and profitability over the years.<BR><BR>Breakdown:<BR>Sumuka Agro's net sales have increased dramatically from 1.39 Cr in March 2022 to 62.30 Cr in March 2025, indicating a strong upward trend. The total operating income followed a similar pattern, rising from 1.39 Cr in March 2022 to 62.30 Cr in March 2025. The company's total expenditure, excluding depreciation, also grew from 1.05 Cr in March 2022 to 58.22 Cr in March 2025, reflecting increased operational activities. Operating profit, however, peaked at 7.04 Cr in March 2024 before dropping to 4.08 Cr in March 2025, while profit before tax reached 5.38 Cr in March 2024 and then fell to 3.66 Cr in March 2025. Profit after tax showed a similar trend, with a high of 4.26 Cr in March 2024, decreasing to 2.74 Cr in March 2025. The company's earnings per share (EPS) fluctuated, peaking at 5.99 in March 2024 and then dropping to 3.85 in March 2025. The operating profit margin decreased from 12.81% in March 2024 to 6.55% in March 2025, while the profit after tax margin also declined from 7.75% to 4.4% in the same period. On the balance sheet, total liabilities increased from 19.86 Cr in March 2023 to 25.18 Cr in March 2024, with total assets also rising from 19.86 Cr to 25.18 Cr. The company's cash flow from operating activities remained negative, reflecting challenges in cash generation despite the growth in sales. Overall, Sumuka Agro has shown substantial growth in sales and profitability, although recent trends indicate some volatility in profit margins and cash flow.

View full answer

How has been the historical performance of Sumuka Agro?

13-Nov-2025

Sumuka Agro has shown significant growth in net sales and profitability, with net sales increasing from INR 1.39 crore in March 2022 to INR 62.30 crore in March 2025, and profit after tax rising from INR 0.24 crore to INR 2.74 crore. However, the company faces cash flow challenges despite its strong revenue growth.

Answer:<BR>The historical performance of Sumuka Agro shows significant growth in net sales and profitability over the years.<BR><BR>Breakdown:<BR>Sumuka Agro's net sales have seen a remarkable increase from INR 1.39 crore in March 2022 to INR 62.30 crore in March 2025, indicating a strong upward trend. The total operating income followed a similar trajectory, rising from INR 1.39 crore in March 2022 to INR 62.30 crore in March 2025. Operating profit, excluding other income, also improved, reaching INR 4.08 crore in March 2025 from just INR 0.34 crore in March 2022. However, the operating profit margin has fluctuated, peaking at 43.81% in March 2021 before declining to 6.55% in March 2025. Profit before tax increased from INR 0.32 crore in March 2022 to INR 3.66 crore in March 2025, while profit after tax rose from INR 0.24 crore to INR 2.74 crore in the same period. The company's total assets increased significantly from INR 3.55 crore in March 2022 to INR 25.18 crore in March 2024, reflecting robust growth in shareholder's funds and reserves. Despite the growth in sales and profits, cash flow from operating activities remained negative, indicating challenges in cash generation. Overall, Sumuka Agro has demonstrated strong revenue growth and improved profitability, although it faces cash flow challenges.

View full answer

Are Sumuka Agro Industries Ltd latest results good or bad?

01-Feb-2026

Sumuka Agro Industries Ltd's latest results show strong revenue growth of 40.56% year-on-year, but a significant contraction in operating margins and a decline in quarterly net profit raise concerns about profitability sustainability. Investors should monitor these trends closely.

Sumuka Agro Industries Ltd's latest results present a mixed picture. On one hand, the company achieved significant revenue growth, with net sales reaching ₹20.93 crores, marking a 40.56% increase year-on-year. This strong topline performance indicates that the company is successfully expanding its market presence.<BR><BR>However, the operating margins have contracted sharply, falling to 4.16% from 9.32% a year ago. This decline raises concerns about the sustainability of profitability as the company scales its operations. The net profit of ₹0.75 crores shows a remarkable year-on-year growth of 294.74%, but it also reflects an 8.54% decline from the previous quarter, which is concerning.<BR><BR>Overall, while the revenue growth is impressive, the significant margin compression and the decline in quarterly net profit suggest that the company is facing challenges in maintaining profitability amidst rising costs and competitive pressures. Investors should closely monitor these trends, as the current growth may not be sustainable if margins continue to erode.

View full answer

Should I buy, sell or hold Sumuka Agro Industries Ltd?

04-Feb-2026

When is the next results date for Sumuka Agro Industries Ltd?

22-May-2026

The next results date for Sumuka Agro Industries Ltd is 28 May 2026.

The next results date for Sumuka Agro Industries Ltd is scheduled for 28 May 2026.

View full answer

Why is Sumuka Agro Industries Ltd falling/rising?

30-May-2026

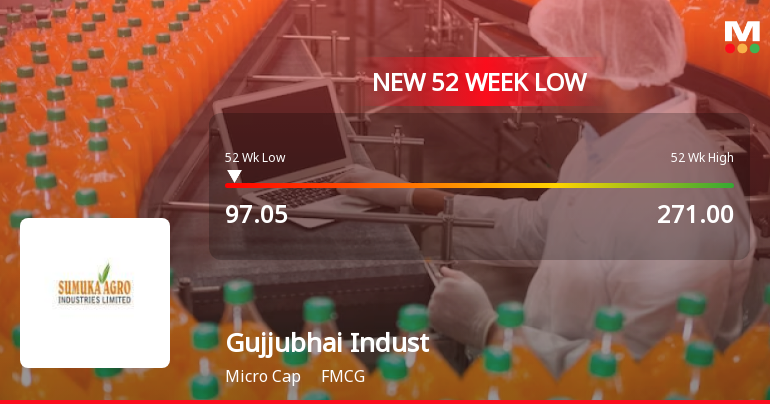
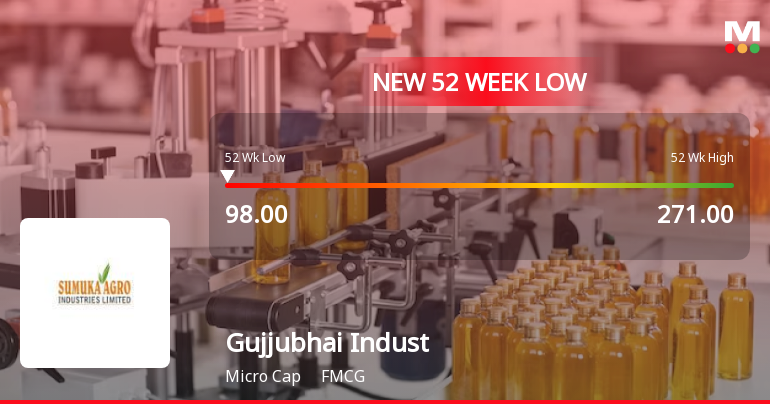
As of 29-May, Sumuka Agro Industries Ltd's stock price is Rs 154.95, down 1.84%, marking a 16.04% decline over the last nine days. The stock has significantly underperformed the market, with a year-to-date drop of 29.30%, and is nearing its 52-week low.

As of 29-May, Sumuka Agro Industries Ltd is experiencing a decline in its stock price, currently at Rs 154.95, which reflects a decrease of Rs 2.9 or 1.84%. The stock has been on a downward trend, having fallen consecutively for the last nine days, resulting in a total decline of 16.04% during this period. Additionally, the stock is trading significantly lower than its moving averages across various time frames, including the 5-day, 20-day, 50-day, 100-day, and 200-day averages, indicating a sustained bearish trend.<BR><BR>In terms of performance relative to the broader market, the stock has underperformed significantly over various periods. For instance, it has dropped 29.30% year-to-date and 38.51% over the past year, while the Sensex has only decreased by 12.26% and 8.40%, respectively. This stark contrast highlights the stock's struggles compared to the market benchmark.<BR><BR>Moreover, the stock is close to its 52-week low, being just 3.45% away from Rs 149.6. The sector in which Sumuka operates, Paper & Paper Products, has also seen a decline of 2.01%, which may contribute to the negative sentiment surrounding the stock. Although there has been a rise in investor participation, with delivery volume increasing by 130.64% against the 5-day average, this has not been sufficient to counteract the overall downward pressure on the stock price.

View full answer
iScoreScore
Click here to find our call on this stock
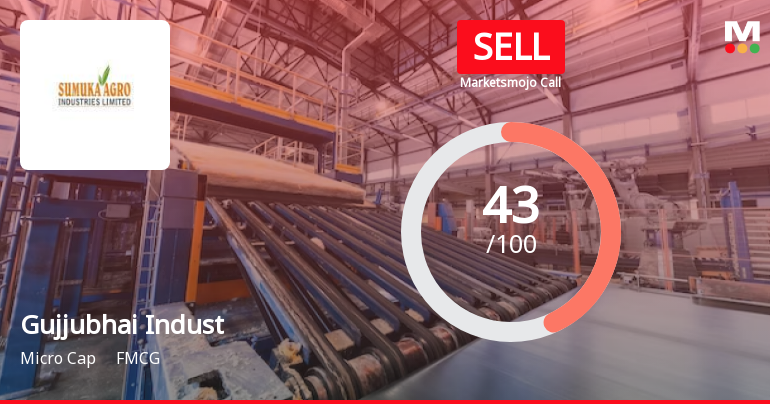
Strong Sell
Sell
Hold
Buy
Strong Buy

Dashboard

1

With ROCE of 18.2, it has a Very Expensive valuation with a 15.4 Enterprise value to Capital Employed

  • The stock is trading at a premium compared to its peers' average historical valuations
  • Over the past year, while the stock has generated a return of -38.51%, its profits have fallen by -16.7%
2

Underperformed the market in the last 1 year

stock-summaryMojo Parameters

Mojo Parameters

Loading Valuation Snapshot...

Stock DNA

stock-summary
Industry

FMCG

stock-summary
Market cap

INR 328 Cr (Micro Cap)

stock-summary
P/E

105.00

stock-summary
Industry P/E

18

stock-summary
Dividend Yield

0.00%

stock-summary
Debt Equity

0.20

stock-summary
Return on Equity

17.44%

stock-summary
Price to Book

18.63

Revenue and Profits:
Net Sales:
21 Cr
(Quarterly Results - Dec 2025)
Net Profit:
1 Cr
stock-summaryTotal Returns
Total Returns (Price + Dividend) stock-summary
Dividend Yield (0%)
TimePeriod
Price Return
Dividend Return
Total Return
3 Months
-28.38%
0%
-28.38%
6 Months
-26.04%
0%
-26.04%
1 Year
-38.51%
0%
-38.51%
2 Years
-4.23%
0%
-4.23%
3 Years
54.03%
0%
54.03%
4 Years
185.36%
0%
185.36%
5 Years
1208.7%
0%
1208.7%

Sumuka Agro for the last several years.

Risk Adjusted Returns v/s stock-summary
Returns Beta
Icon
Beta has not been calculated since enough price history is not available
stock-summaryNews & Corporate Actions

Announcements stock-summary

Intimation Of Trading Approval Received For 13813666 Equity Shares Of Rs.10/- Each Issued Pursuant To The Scheme Of Merger By Absorption Of Gujjubhai Foods Private Limited (Transferor Company Or GFPL) With Sumuka Agro Industries Limited (Transferee Compan

25-May-2026 | Source : BSE

Pursuant to Regulation 30 of SEBI (LODR) Regulations 2015 we wish to inform you that the Company has received Trading Approval from BSE Limited for 13813666 Equity Shares of Rs. 10/- each pursuant to the scheme of Merger by Absorption of Gujjubhai Foods Private Limited with Sumuka Agro Industries Limited.

Announcement under Regulation 30 (LODR)-Change of Company Name

22-May-2026 | Source : BSE

Pursuant to Regulation 30 of the SEBI (LODR) 2015 read with SEBI Circular No.: HO/49/14/14(7)2025-CFDPOD2/I/3762/2026 dated 30th January 2026 we wish to inform you that the Company has received the approval for change of name vide order dated 20th May 2026 Notice No.: 20260520-35 from BSE Limited.

Board Meeting Intimation for Intimation Of Board Meeting Schedule To Be Held On Thursday 28Th May 2026.

21-May-2026 | Source : BSE

Sumuka Agro Industries Ltdhas informed BSE that the meeting of the Board of Directors of the Company is scheduled on 28/05/2026 inter alia to consider and approve 1. To consider and approve the audited Financial Results for the quarter and year ended March 31 2026 along with the Audit Reports of the Statutory Auditors. 2. To consider and approve the appointment of M/s S K Jha & Co. Chartered Accountants Ahmedabad as Statutory Auditor of the Company. 3. To consider and approve the appointment of the Secretarial Auditor of the Company for Financial Year 2026-27 to 2030-31. 4. To transact any other business with the permission of the Chair.

Corporate Actions stock-summary

stock-summary
BOARD MEETING

(30 May 2026)

stock-summary
DIVIDEND

No Dividend history available

stock-summary
SPLITS

No Splits history available

stock-summary
BONUS

No Bonus history available

stock-summary
RIGHTS

No Rights history available

stock-summaryKey Factors

Quality key factors stock-summary

Factor
Value
Sales Growth (5y)
140.23%
EBIT Growth (5y)
37.02%
EBIT to Interest (avg)
3.46
Debt to EBITDA (avg)
0.37
Net Debt to Equity (avg)
0.20
Sales to Capital Employed (avg)
2.24
Tax Ratio
7.10%
Dividend Payout Ratio
0
Pledged Shares
0
Institutional Holding
5.22%
ROCE (avg)
23.49%
ROE (avg)
31.59%

Valuation key factors

Factor
Value
P/E Ratio
105
Industry P/E
18
Price to Book Value
18.28
EV to EBIT
86.03
EV to EBITDA
83.20
EV to Capital Employed
15.35
EV to Sales
4.13
PEG Ratio
NA
Dividend Yield
NA
ROCE (Latest)
18.22%
ROE (Latest)
17.44%

Technicals key factors

Indicator
Weekly
Monthly
MACD
Bearish
Mildly Bearish
RSI
Bullish
No Signal
Bollinger Bands
Bearish
Bearish
Moving Averages
Bearish (Daily)
KST
Bearish
Mildly Bearish
Dow Theory
Mildly Bearish
No Trend
stock-summary Technical Indicator Scale: Bearish, Mildly Bearish, Sideways, Mildly Bullish, Bullish  Turned 
stock-summaryShareholding
Shareholding Snapshot : Mar 2026stock-summary
Shareholding Compare (%holding) stock-summary
Majority shareholders

Promoters

Pledged Promoter Holdings

None

Mutual Funds

Held by 0 Schemes

FIIs

Held by 2 FIIs (4.38%)

Promoter with highest holding

Shaili Vijaybhai Patel (23.98%)

Highest Public shareholder

Jayaraman Vishwanathan (5.25%)

Individual Investors Holdings

24.18%

stock-summaryFinancial
[
  {
    "link": "quarterly",
    "btn_text": "All Quarterly Results",
    "header": "Quarterly Results Snapshot (Standalone) - Dec'25 - YoY",
    "rhs": [
      {
        "prefix": "Net Sales ",
        "suffix": "YoY Growth in quarter ended Dec 2025 is 24.31% vs 29.90% in Dec 2024",
        "dir": -1
      },
      {
        "prefix": "Standalone Net Profit ",
        "suffix": "YoY Growth in quarter ended Dec 2025 is 8.45% vs -10.13% in Dec 2024",
        "dir": 1
      }
    ],
    "table": {
      "header": [
        "Dec'25",
        "Dec'24",
        "Change(%)"
      ],
      "body": [
        {
          "field": "Net Sales",
          "val1": "21.17",
          "val2": "17.03",
          "chgp": "24.31%",
          "chgp_class": "positive"
        },
        {
          "field": "Operating Profit (PBDIT) excl Other Income",
          "val1": "0.90",
          "val2": "0.98",
          "chgp": "-8.16%",
          "chgp_class": "negative"
        },
        {
          "field": "Interest",
          "val1": "0.10",
          "val2": "0.00",
          "chgp": "",
          "chgp_class": "neutral"
        },
        {
          "field": "Exceptional Items",
          "val1": "0.00",
          "val2": "0.00",
          "chgp": "",
          "chgp_class": "neutral"
        },
        {
          "field": "Standalone Net Profit",
          "val1": "0.77",
          "val2": "0.71",
          "chgp": "8.45%",
          "chgp_class": "positive"
        },
        {
          "field": "Operating Profit Margin (Excl OI)",
          "val1": "4.25%",
          "val2": "5.75%",
          "chgp": "-1.50%",
          "chgp_class": "negative"
        }
      ]
    }
  },
  {
    "link": "half-yearly",
    "btn_text": "All Half Yearly Results",
    "header": "Half Yearly Results Snapshot (Standalone) - Sep'25",
    "rhs": [
      {
        "prefix": "Net Sales ",
        "suffix": " Growth in half year ended Sep 2025 is 46.27% vs 20.74% in Sep 2024",
        "dir": 1
      },
      {
        "prefix": "Standalone Net Profit ",
        "suffix": " Growth in half year ended Sep 2025 is -13.26% vs -27.89% in Sep 2024",
        "dir": 1
      }
    ],
    "table": {
      "header": [
        "Sep'25",
        "Sep'24",
        "Change(%)"
      ],
      "body": [
        {
          "field": "Net Sales",
          "val1": "40.62",
          "val2": "27.77",
          "chgp": "46.27%",
          "chgp_class": "positive"
        },
        {
          "field": "Operating Profit (PBDIT) excl Other Income",
          "val1": "1.84",
          "val2": "1.89",
          "chgp": "-2.65%",
          "chgp_class": "negative"
        },
        {
          "field": "Interest",
          "val1": "0.21",
          "val2": "0.00",
          "chgp": "",
          "chgp_class": "neutral"
        },
        {
          "field": "Exceptional Items",
          "val1": "0.00",
          "val2": "0.00",
          "chgp": "",
          "chgp_class": "neutral"
        },
        {
          "field": "Standalone Net Profit",
          "val1": "1.57",
          "val2": "1.81",
          "chgp": "-13.26%",
          "chgp_class": "negative"
        },
        {
          "field": "Operating Profit Margin (Excl OI)",
          "val1": "4.53%",
          "val2": "6.81%",
          "chgp": "-2.28%",
          "chgp_class": "negative"
        }
      ]
    }
  },
  {
    "link": "nine-monthly",
    "btn_text": "All Nine Monthly Results",
    "header": "Nine Monthly Results Snapshot (Standalone) - Dec'25",
    "rhs": [
      {
        "prefix": "Net Sales ",
        "suffix": "YoY Growth in nine months ended Dec 2025 is 37.92% vs 24.07% in Dec 2024",
        "dir": 1
      },
      {
        "prefix": "Standalone Net Profit ",
        "suffix": "YoY Growth in nine months ended Dec 2025 is -7.14% vs -23.64% in Dec 2024",
        "dir": 1
      }
    ],
    "table": {
      "header": [
        "Dec'25",
        "Dec'24",
        "Change(%)"
      ],
      "body": [
        {
          "field": "Net Sales",
          "val1": "61.79",
          "val2": "44.80",
          "chgp": "37.92%",
          "chgp_class": "positive"
        },
        {
          "field": "Operating Profit (PBDIT) excl Other Income",
          "val1": "2.74",
          "val2": "2.87",
          "chgp": "-4.53%",
          "chgp_class": "negative"
        },
        {
          "field": "Interest",
          "val1": "0.31",
          "val2": "0.00",
          "chgp": "",
          "chgp_class": "neutral"
        },
        {
          "field": "Exceptional Items",
          "val1": "0.00",
          "val2": "0.00",
          "chgp": "",
          "chgp_class": "neutral"
        },
        {
          "field": "Standalone Net Profit",
          "val1": "2.34",
          "val2": "2.52",
          "chgp": "-7.14%",
          "chgp_class": "negative"
        },
        {
          "field": "Operating Profit Margin (Excl OI)",
          "val1": "4.43%",
          "val2": "6.41%",
          "chgp": "-1.98%",
          "chgp_class": "negative"
        }
      ]
    }
  },
  {
    "link": "annual",
    "btn_text": "All Annual Results",
    "header": "Annual Results Snapshot (Standalone) - Mar'25",
    "rhs": [
      {
        "prefix": "Net Sales ",
        "suffix": "YoY Growth in year ended Mar 2025 is 13.38% vs 97.09% in Mar 2024",
        "dir": -1
      },
      {
        "prefix": "Standalone Net Profit ",
        "suffix": "YoY Growth in year ended Mar 2025 is -35.68% vs 83.62% in Mar 2024",
        "dir": -1
      }
    ],
    "table": {
      "header": [
        "Mar'25",
        "Mar'24",
        "Change(%)"
      ],
      "body": [
        {
          "field": "Net Sales",
          "val1": "62.30",
          "val2": "54.95",
          "chgp": "13.38%",
          "chgp_class": "positive"
        },
        {
          "field": "Operating Profit (PBDIT) excl Other Income",
          "val1": "4.08",
          "val2": "7.04",
          "chgp": "-42.05%",
          "chgp_class": "negative"
        },
        {
          "field": "Interest",
          "val1": "0.16",
          "val2": "0.01",
          "chgp": "1,500.00%",
          "chgp_class": "negative"
        },
        {
          "field": "Exceptional Items",
          "val1": "-0.11",
          "val2": "-1.48",
          "chgp": "92.57%",
          "chgp_class": "positive"
        },
        {
          "field": "Standalone Net Profit",
          "val1": "2.74",
          "val2": "4.26",
          "chgp": "-35.68%",
          "chgp_class": "negative"
        },
        {
          "field": "Operating Profit Margin (Excl OI)",
          "val1": "6.55%",
          "val2": "12.81%",
          "chgp": "-6.26%",
          "chgp_class": "negative"
        }
      ]
    }
  }
]

Quarterly Results Snapshot (Standalone) - Dec'25 - YoYstock-summary

Dec'25
Dec'24
Change(%)
Net Sales
21.17
17.03
24.31%
Operating Profit (PBDIT) excl Other Income
0.90
0.98
-8.16%
Interest
0.10
0.00
Exceptional Items
0.00
0.00
Standalone Net Profit
0.77
0.71
8.45%
Operating Profit Margin (Excl OI)
4.25%
5.75%
-1.50%
Values in Rs Cr.
Direction Arrows
Net Sales

YoY Growth in quarter ended Dec 2025 is 24.31% vs 29.90% in Dec 2024

Direction Arrows
Standalone Net Profit

YoY Growth in quarter ended Dec 2025 is 8.45% vs -10.13% in Dec 2024

Half Yearly Results Snapshot (Standalone) - Sep'25stock-summary

Sep'25
Sep'24
Change(%)
Net Sales
40.62
27.77
46.27%
Operating Profit (PBDIT) excl Other Income
1.84
1.89
-2.65%
Interest
0.21
0.00
Exceptional Items
0.00
0.00
Standalone Net Profit
1.57
1.81
-13.26%
Operating Profit Margin (Excl OI)
4.53%
6.81%
-2.28%
Values in Rs Cr.
Direction Arrows
Net Sales

Growth in half year ended Sep 2025 is 46.27% vs 20.74% in Sep 2024

Direction Arrows
Standalone Net Profit

Growth in half year ended Sep 2025 is -13.26% vs -27.89% in Sep 2024

Nine Monthly Results Snapshot (Standalone) - Dec'25stock-summary

Dec'25
Dec'24
Change(%)
Net Sales
61.79
44.80
37.92%
Operating Profit (PBDIT) excl Other Income
2.74
2.87
-4.53%
Interest
0.31
0.00
Exceptional Items
0.00
0.00
Standalone Net Profit
2.34
2.52
-7.14%
Operating Profit Margin (Excl OI)
4.43%
6.41%
-1.98%
Values in Rs Cr.
Direction Arrows
Net Sales

YoY Growth in nine months ended Dec 2025 is 37.92% vs 24.07% in Dec 2024

Direction Arrows
Standalone Net Profit

YoY Growth in nine months ended Dec 2025 is -7.14% vs -23.64% in Dec 2024

Annual Results Snapshot (Standalone) - Mar'25stock-summary

Mar'25
Mar'24
Change(%)
Net Sales
62.30
54.95
13.38%
Operating Profit (PBDIT) excl Other Income
4.08
7.04
-42.05%
Interest
0.16
0.01
1,500.00%
Exceptional Items
-0.11
-1.48
92.57%
Standalone Net Profit
2.74
4.26
-35.68%
Operating Profit Margin (Excl OI)
6.55%
12.81%
-6.26%
Values in Rs Cr.
Direction Arrows
Net Sales

YoY Growth in year ended Mar 2025 is 13.38% vs 97.09% in Mar 2024

Direction Arrows
Standalone Net Profit

YoY Growth in year ended Mar 2025 is -35.68% vs 83.62% in Mar 2024

stock-summaryCompany CV
About Sumuka Agro Industries Ltd stock-summary
stock-summary
Sumuka Agro Industries Ltd
Micro Cap
FMCG
Sumuka Agro Industries Limited (Formerly known as Superb Papers Limited) was incorporated in June, 1989. The Company name was changed from `Superb Papers Limited' to `Sumuka Agro Industries Limited' with effect from September 15, 2016. The Company was engaged in the business of manufacturing & dealing in machinery for paper industry earlier.
Company Coordinates stock-summary
Company Details
Shop No 1& 7 Ground Floor, Empress Chamber Kandivali (W) Mumbai Maharashtra : 400067
stock-summary
Tel:
stock-summary
sumukaagro@gmail.com
Registrar Details
Purva Shareregistry (India) Pvt Ltd , Gala No 9, Shiv Shakti, Industrial Estate,Sitaram Mill Comp., J R Boricha Marg, Lower Parel [E], Mumbai