
Compare Sumuka Agro with Similar Stocks
Dashboard
With ROCE of 13.5, it has a Very Expensive valuation with a 6.9 Enterprise value to Capital Employed
- The stock is trading at a premium compared to its peers' average historical valuations
- Over the past year, while the stock has generated a return of -43.33%, its profits have risen by 16.2%
Below par performance in long term as well as near term
Total Returns (Price + Dividend) 
Sumuka Agro for the last several years.
Risk Adjusted Returns v/s
Returns Beta

News
Are Sumuka Agro Industries Ltd latest results good or bad?
Sumuka Agro Industries Ltd's latest financial results for Q4 FY26 reflect a complex operational landscape. The company reported net sales of ₹39.61 crores, which signifies a year-on-year growth of 43.88% and a sequential increase of 20.98%. This marks the highest quarterly revenue figure in the company's history, driven by strong volume expansion and market penetration efforts. However, the net profit for the same quarter stood at ₹1.78 crores, showing a year-on-year growth of only 9.88%, which is a notable decline from previous periods. The operating margin was recorded at 8.96%, which, while improved from the prior quarter, represents a significant contraction of 343 basis points compared to the same quarter last year. This margin compression indicates challenges in maintaining profitability amidst rising input costs and competitive pressures. The company's return on equity (ROE) remains robust at 24.62...
Read full news article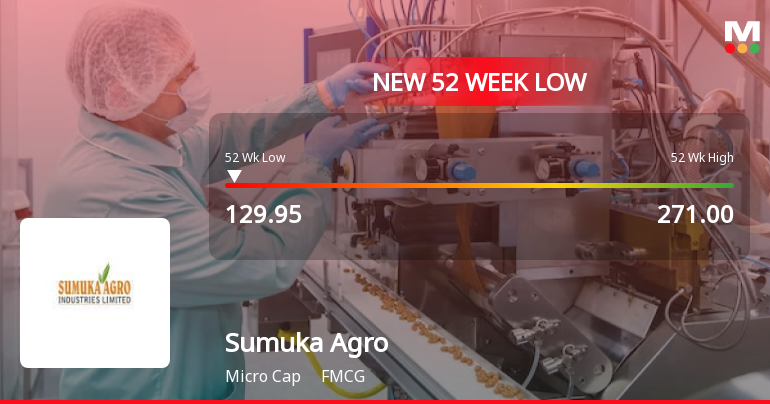
Eleven-Day Slide Pushes Sumuka Agro Industries Ltd to 52-Week Low of Rs 129.95
For the eleventh consecutive session, Sumuka Agro Industries Ltd closed lower, culminating in a fresh 52-week low of Rs 129.95 on 2 June 2026. This persistent decline has dragged the stock down by 27.45% over this period, sharply underperforming its FMCG sector peers and the broader market indices.
Read full news article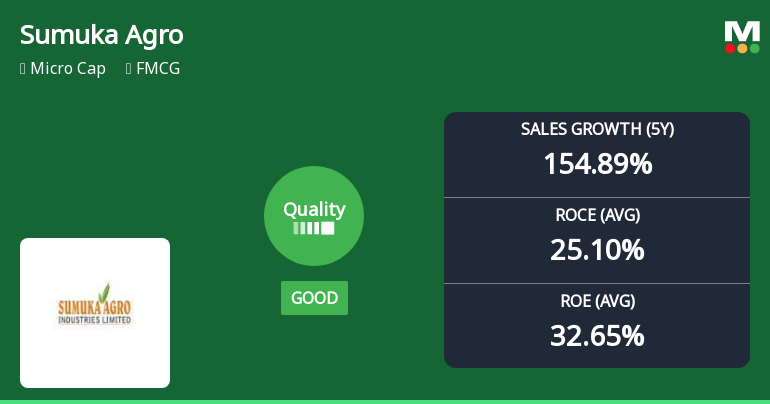
Sumuka Agro Industries Ltd Quality Grade Upgrade Signals Improved Business Fundamentals
Sumuka Agro Industries Ltd has recently seen its quality grade upgraded from average to good, reflecting notable improvements in its core business fundamentals. This article analyses the key financial metrics driving this upgrade, including return on equity (ROE), return on capital employed (ROCE), debt levels, and growth consistency, while placing the company’s performance in the context of its FMCG sector peers and broader market trends.
Read full news article Announcements
Announcement under Regulation 30 (LODR)-Newspaper Publication
01-Jun-2026 | Source : BSEPursuant to Regulation 30 and 47 of the SEBI (LODR) Regulations 2015 please find enclosed herewith copies of Newspaper Advertisements of Audited Standalone Financial Statements for the quarter and year ended March 31 2026.
Announcement under Regulation 30 (LODR)-Investor Presentation
01-Jun-2026 | Source : BSEWith reference to subject matter and pursuant to Regulation 30 of the SEBI (LODR) Regulation 2015 we are enclosing herewith presentation on Audited Standalone Financial Statement for quarter and year ended March 31 2026.
Compliances-Reg.24(A)-Annual Secretarial Compliance
30-May-2026 | Source : BSEPursuant to Regulation 24A of the SEBI (LODR) Regulations 2015 as amended we are forwarding herewith Annual Secretarial Compliance Report of Gujjubhai Industries Limited for year ended on 31st March 2026.
Corporate Actions

No Upcoming Board Meetings

No Dividend history available

No Splits history available

No Bonus history available

No Rights history available
Quality key factors
Valuation key factors
Technicals key factors
 Technical Indicator Scale: Bearish, Mildly Bearish, Sideways, Mildly Bullish, Bullish Turned
 Shareholding Snapshot : Mar 2026
Shareholding Compare (%holding)
Promoters
None
Held by 0 Schemes
Held by 2 FIIs (4.38%)
Shaili Vijaybhai Patel (23.98%)
Jayaraman Vishwanathan (5.25%)
24.18%
Quarterly Results Snapshot (Standalone) - Mar'26 - YoY

YoY Growth in quarter ended Mar 2026 is 43.88% vs 46.13% in Mar 2025
YoY Growth in quarter ended Mar 2026 is 9.88% vs 68.75% in Mar 2025
Half Yearly Results Snapshot (Standalone) - Sep'25

Growth in half year ended Sep 2025 is 46.27% vs 20.74% in Sep 2024
Growth in half year ended Sep 2025 is -13.26% vs -27.89% in Sep 2024
Nine Monthly Results Snapshot (Standalone) - Dec'25
YoY Growth in nine months ended Dec 2025 is 63.75% vs 24.07% in Dec 2024
YoY Growth in nine months ended Dec 2025 is 0.79% vs -23.64% in Dec 2024
Annual Results Snapshot (Standalone) - Mar'26
YoY Growth in year ended Mar 2026 is 30.07% vs 77.78% in Mar 2025
YoY Growth in year ended Mar 2026 is 10.68% vs 9.86% in Mar 2025
About Sumuka Agro Industries Ltd

Company Coordinates


