
Compare Sumuka Agro with Similar Stocks
Dashboard
With ROCE of 18.2, it has a Very Expensive valuation with a 15.6 Enterprise value to Capital Employed
- The stock is trading at a premium compared to its peers' average historical valuations
- Over the past year, while the stock has generated a return of -16.18%, its profits have fallen by -16.7%
Underperformed the market in the last 1 year
Total Returns (Price + Dividend) 
Sumuka Agro for the last several years.
Risk Adjusted Returns v/s
Returns Beta

News
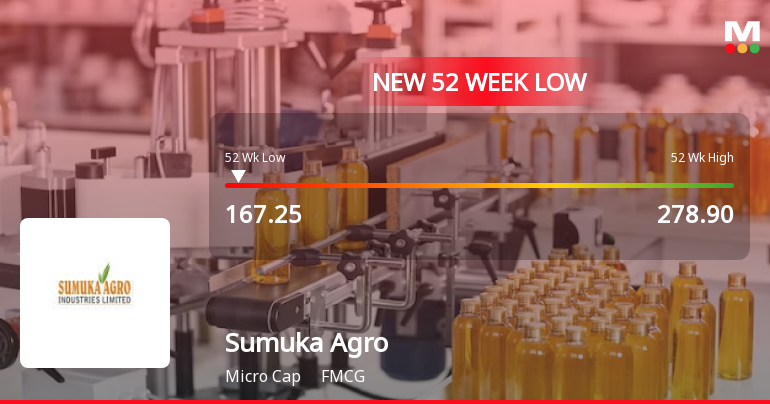
Sumuka Agro Industries Ltd Falls to 52-Week Low of Rs 157.1 as Sell-Off Deepens
A sharp decline of 11.27% today dragged Sumuka Agro Industries Ltd to a fresh 52-week low of Rs 157.1, extending its recent downtrend amid heightened volatility and sector underperformance.
Read full news article
Sumuka Agro Industries Ltd is Rated Sell
Sumuka Agro Industries Ltd is rated 'Sell' by MarketsMOJO, with this rating last updated on 03 February 2026. However, the analysis and financial metrics discussed here reflect the stock's current position as of 04 April 2026, providing investors with the latest insights into its performance and outlook.
Read full news article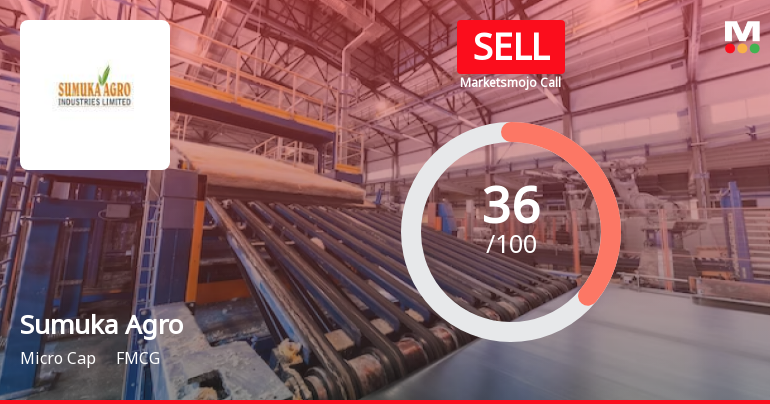
Sumuka Agro Industries Ltd is Rated Sell
Sumuka Agro Industries Ltd is rated 'Sell' by MarketsMOJO, with this rating last updated on 03 February 2026. However, the analysis and financial metrics discussed here reflect the stock's current position as of 24 March 2026, providing investors with the latest insights into its performance and outlook.
Read full news article Announcements
Announcement under Regulation 30 (LODR)-Change of Company Name
07-Apr-2026 | Source : BSEIntimation for change of name of the Company pursuant to the scheme of Merger by Absorption of Gujjubhai Foods Private Limited (Transferor Company) with Sumuka Agro Industries Limited (Transfree Company) disclosure under Regulation 30 of the SEBI (Listing Obligantions and Disclosure Requirements) Regultions 2015 (SEBI LODR Regulations)
Closure of Trading Window
31-Mar-2026 | Source : BSEPursunat to SEBI (Prohibition of Insider Trading) Regulations 2015 and the COmpanys Code of Conduct to regulate monitor and report trading by Designated Persons and their immediate relatives read with the provisons of Sub Regulation (1) of Regulation (9) of SEBI (Prohibition of Insider Trading) Regulations 2015 as amended we wish to inform you that in view of consideration and declaration of the Audited Financial Results (Standalone) for the quarter and year ended March 31 2026 the trading window for dealing in the securities of the COmpany will reamain closed for all designated persons and their immediate relatives as well as insider covered and defined under the Code of conduct from april 01 2026 untill 48 hours after declaration of the audited financial results for the quarter and year ended march 31 2026.
Board Meeting Outcome for Outcome Of The Meeting Of The Board Of Directors Of Company Held Today I.E. March 30 2026
30-Mar-2026 | Source : BSEPursuant to Regulation 30 and 33 read with Schedule III - Part A and other applicable provisions of the SEBI (Listing Obligations and Disclosure Requirements) Regulations 2015 (SEBI Listing Regulations) the board at its meeting held today i.e. Monday March 30 2026 inter alia: 1. Considered and approved the Increase in authorised share capital of the Company from existing Rs. 214250000 /- (Rupees Twenty one crore forty two lakh fifty thousand only) divided into 21425000 (Two crore fourteen lakh twenty five thousand) Equity Shares of Rs. 10/- (Rupees Ten only) each to Rs. 350000000/- (Rupees Thirty-five crore only) divided into 35000000 (Three crore fifty lakh) Equity Shares of Rs. 10/- each (Rupees Ten each).
Corporate Actions

No Upcoming Board Meetings

No Dividend history available

No Splits history available

No Bonus history available

No Rights history available
Quality key factors
Valuation key factors
Technicals key factors
 Technical Indicator Scale: Bearish, Mildly Bearish, Sideways, Mildly Bullish, Bullish Turned
 Shareholding Snapshot : Dec 2025
Shareholding Compare (%holding)
Non Institution
None
Held by 0 Schemes
Held by 2 FIIs (12.89%)
Vishal Vipinbhai Bhatt (8.81%)
Aegis Investment Fund Pcc (7.6%)
40.68%
Quarterly Results Snapshot (Standalone) - Dec'25 - YoY

YoY Growth in quarter ended Dec 2025 is 24.31% vs 29.90% in Dec 2024

YoY Growth in quarter ended Dec 2025 is 8.45% vs -10.13% in Dec 2024
Half Yearly Results Snapshot (Standalone) - Sep'25
Growth in half year ended Sep 2025 is 46.27% vs 20.74% in Sep 2024
Growth in half year ended Sep 2025 is -13.26% vs -27.89% in Sep 2024
Nine Monthly Results Snapshot (Standalone) - Dec'25
YoY Growth in nine months ended Dec 2025 is 37.92% vs 24.07% in Dec 2024
YoY Growth in nine months ended Dec 2025 is -7.14% vs -23.64% in Dec 2024
Annual Results Snapshot (Standalone) - Mar'25
YoY Growth in year ended Mar 2025 is 13.38% vs 97.09% in Mar 2024
YoY Growth in year ended Mar 2025 is -35.68% vs 83.62% in Mar 2024
About Sumuka Agro Industries Ltd

Company Coordinates


