
Compare Suncity Synth. with Similar Stocks
Dashboard
With a Negative Book Value, the company has a Weak Long Term Fundamental Strength
- Poor long term growth as Net Sales has grown by an annual rate of -30.85% and Operating profit at -180.93% over the last 5 years
- The company has a negative book value of Rs 0.46 crore
- The company has been able to generate a Return on Equity (avg) of 0.05% signifying low profitability per unit of shareholders funds
Flat results in Mar 26
Risky - Negative EBITDA
Underperformed the market in the last 1 year
Stock DNA
Garments & Apparels
INR 4 Cr (Micro Cap)
NA (Loss Making)
26
0.00%
-0.24
36.00%
-4.45
Total Returns (Price + Dividend) 
Suncity Synth. for the last several years.
Risk Adjusted Returns v/s
Returns Beta

News
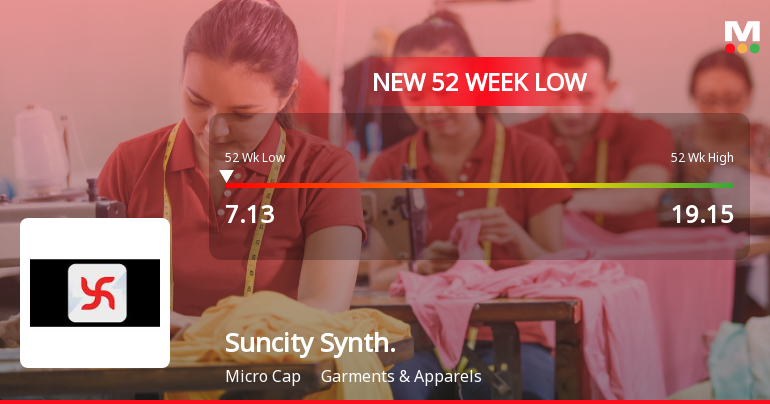
Suncity Synthetics Ltd Falls to 52-Week Low of Rs 7.13 as Sell-Off Deepens
For the second consecutive session, Suncity Synthetics Ltd has succumbed to selling pressure, hitting a fresh 52-week low of Rs 7.13 on 11 Jun 2026. This decline extends the stock’s year-long slide, which now stands at a steep -60.80%, far outpacing the Sensex’s -10.01% loss over the same period.
Read full news article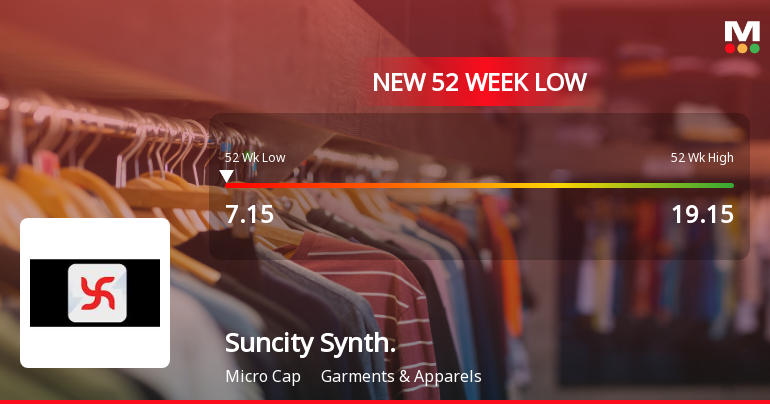
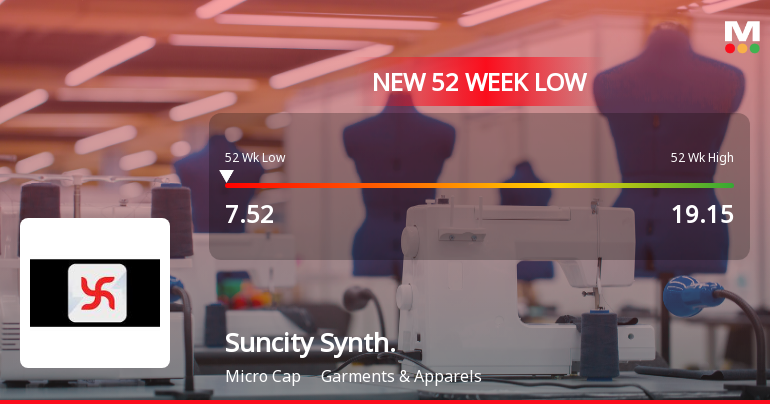
Suncity Synthetics Ltd Falls to 52-Week Low of Rs 7.52 as Sell-Off Deepens
For the fifth consecutive session, Suncity Synthetics Ltd closed lower, hitting a fresh 52-week low of Rs 7.52 on 8 June 2026. This decline extends the stock’s downward spiral, now down 55.53% over the past year, significantly underperforming the Sensex’s 10.33% fall during the same period.
Read full news article Announcements
Compliances-Certificate under Reg. 74 (5) of SEBI (DP) Regulations 2018
04-Jul-2026 | Source : BSEENCLOSED HEREWITH RTA CERTIFICATE UNDER REGULATION 74(5) OF SEBI (DP) REGULATIONS 2018 FOR QUARTER ENDED JUNE 30 2026
Closure of Trading Window
25-Jun-2026 | Source : BSEENCLOSED HEREWITH INTIMATION OF CLOSURE OF TRADING WINDOW FOR QUARTER ENDED JUNE 30 2026
Announcement under Regulation 30 (LODR)-Newspaper Publication
01-Jun-2026 | Source : BSEEnclosed Herwith Newspaper Advertisment for BM dated 30.05.2026 for the Financial Result for Quarter and Year ended 31.03.2026
Corporate Actions

No Upcoming Board Meetings

No Dividend history available

No Splits history available

No Bonus history available

No Rights history available
Quality key factors
Valuation key factors
Technicals key factors
 Technical Indicator Scale: Bearish, Mildly Bearish, Sideways, Mildly Bullish, Bullish Turned
 Shareholding Snapshot : Jun 2026
Shareholding Compare (%holding)
Non Institution
None
Held by 3 Schemes (3.02%)
Held by 1 FIIs (3.03%)
Sumita Mishra (45.46%)
Harsha Hitesh Javeri (4.14%)
37.35%
Quarterly Results Snapshot (Standalone) - Mar'26 - QoQ

QoQ Growth in quarter ended Mar 2026 is 45.45% vs 144.44% in Dec 2025
QoQ Growth in quarter ended Mar 2026 is -175.00% vs 300.00% in Dec 2025
Half Yearly Results Snapshot (Standalone) - Sep'25
Growth in half year ended Sep 2025 is -79.17% vs 9.09% in Sep 2024

Growth in half year ended Sep 2025 is 106.25% vs -60.00% in Sep 2024
Nine Monthly Results Snapshot (Standalone) - Dec'25
YoY Growth in nine months ended Dec 2025 is -63.79% vs 17.17% in Dec 2024
YoY Growth in nine months ended Dec 2025 is 147.62% vs 34.38% in Dec 2024
Annual Results Snapshot (Standalone) - Mar'26
YoY Growth in year ended Mar 2026 is -35.90% vs -41.50% in Mar 2025
YoY Growth in year ended Mar 2026 is 107.14% vs -530.77% in Mar 2025
About Suncity Synthetics Ltd

Company Coordinates


