
Compare Sundram Fasten. with Similar Stocks
Dashboard
High Management Efficiency with a high ROCE of 16.93%
Strong ability to service debt as the company has a low Debt to EBITDA ratio of 0.63 times
Poor long term growth as Operating profit has grown by an annual rate 9.56% of over the last 5 years
Flat results in Mar 26
With ROCE of 15.8, it has a Expensive valuation with a 4.3 Enterprise value to Capital Employed
High Institutional Holdings at 33.71%
Consistent Underperformance against the benchmark over the last 3 years
Stock DNA
Auto Components & Equipments
INR 20,133 Cr (Small Cap)
34.00
33
0.84%
0.12
14.06%
4.69
Total Returns (Price + Dividend) 
Latest dividend: 4.242222550177096 per share ex-dividend date: May-08-2026
Risk Adjusted Returns v/s
Returns Beta

News
When is the next results date for Sundram Fasteners Ltd?
The next results date for Sundram Fasteners Ltd is scheduled for August 4, 2026....
Read full news article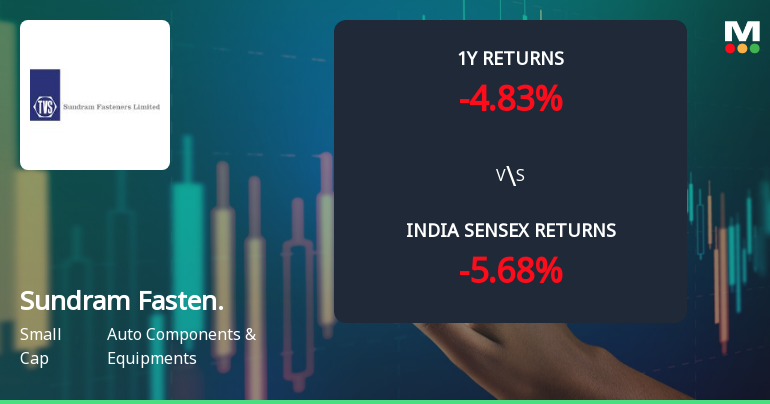
Sundram Fasteners Ltd Technical Momentum Shifts Signal Mild Bullish Outlook
Sundram Fasteners Ltd has exhibited a notable shift in its technical momentum, transitioning from a sideways trend to a mildly bullish stance. This change is underpinned by a combination of weekly and monthly technical indicators, including MACD, Bollinger Bands, and KST, signalling improving price dynamics despite some mixed signals from moving averages and volume-based metrics.
Read full news article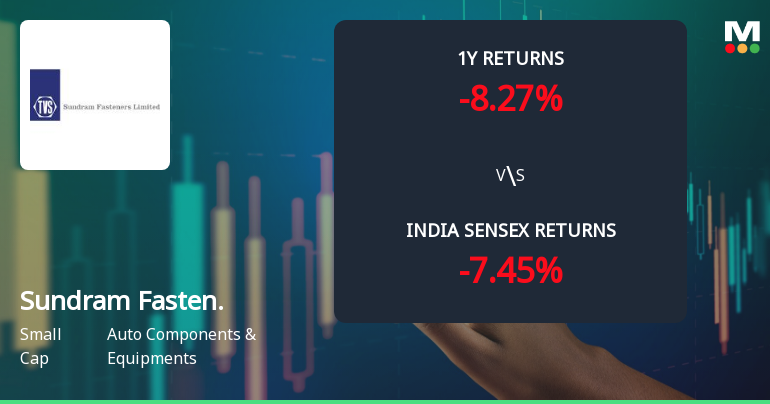
Sundram Fasteners Ltd Technical Momentum Shifts Amid Mixed Market Signals
Sundram Fasteners Ltd has experienced a notable shift in its technical momentum, moving from a mildly bullish stance to a more sideways trend, reflecting a complex interplay of technical indicators. Despite a recent downgrade in daily moving averages and a slight dip in price, the stock’s weekly and monthly signals present a nuanced picture for investors navigating the auto components sector.
Read full news article Announcements
Closure of Trading Window
28-Jul-2026 | Source : BSEIntimation of closure of trading window
Board Meeting Intimation for Intimation Of Board Meeting For Approving The Unaudited Financial Results For The Quarter Ended June 30 2026
28-Jul-2026 | Source : BSESundram Fasteners Ltdhas informed BSE that the meeting of the Board of Directors of the Company is scheduled on 04/08/2026 inter alia to consider and approve the Unaudited financial results for the quarter ended June 30 2026
Announcement under Regulation 30 (LODR)-Credit Rating
06-Jul-2026 | Source : BSEIntimation of re-affirmation of credit rating
Corporate Actions

04 Aug 2026

Sundram Fasteners Ltd has declared 425% dividend, ex-date: 08 May 26

No Splits history available

Sundram Fasteners Ltd has announced 1:1 bonus issue, ex-date: 04 Jan 07

No Rights history available
Quality key factors
Valuation key factors
Technicals key factors
 Technical Indicator Scale: Bearish, Mildly Bearish, Sideways, Mildly Bullish, Bullish Turned
 Shareholding Snapshot : Jun 2026
Shareholding Compare (%holding)
Promoters
None
Held by 15 Schemes (20.15%)
Held by 125 FIIs (11.4%)
Tvs Sundram Fasteners Private Limited (46.79%)
Sbi Automotive Opportunities Fund And Sub Accounts (9.24%)
16.36%
Quarterly Results Snapshot (Consolidated) - Mar'26 - QoQ

QoQ Growth in quarter ended Mar 2026 is 9.88% vs 1.32% in Dec 2025
QoQ Growth in quarter ended Mar 2026 is 23.61% vs -13.46% in Dec 2025
Half Yearly Results Snapshot (Consolidated) - Sep'25

Growth in half year ended Sep 2025 is 2.37% vs 5.34% in Sep 2024
Growth in half year ended Sep 2025 is 5.24% vs 9.57% in Sep 2024
Nine Monthly Results Snapshot (Consolidated) - Dec'25
YoY Growth in nine months ended Dec 2025 is 3.86% vs 5.36% in Dec 2024
YoY Growth in nine months ended Dec 2025 is 3.65% vs 6.84% in Dec 2024
Annual Results Snapshot (Consolidated) - Mar'26
YoY Growth in year ended Mar 2026 is 5.60% vs 5.10% in Mar 2025
YoY Growth in year ended Mar 2026 is 9.66% vs 3.34% in Mar 2025
About Sundram Fasteners Ltd

Company Coordinates


