
Compare Sundrop Brands with Similar Stocks
Total Returns (Price + Dividend) 
Latest dividend: 3 per share ex-dividend date: Sep-20-2024
Risk Adjusted Returns v/s
Returns Beta

News

Sundrop Brands Ltd is Rated Sell
Sundrop Brands Ltd is rated Sell by MarketsMOJO, with this rating last updated on 08 May 2026. However, the analysis and financial metrics presented here reflect the stock’s current position as of 14 June 2026, providing investors with an up-to-date view of the company’s fundamentals, valuation, financial trends, and technical outlook.
Read full news article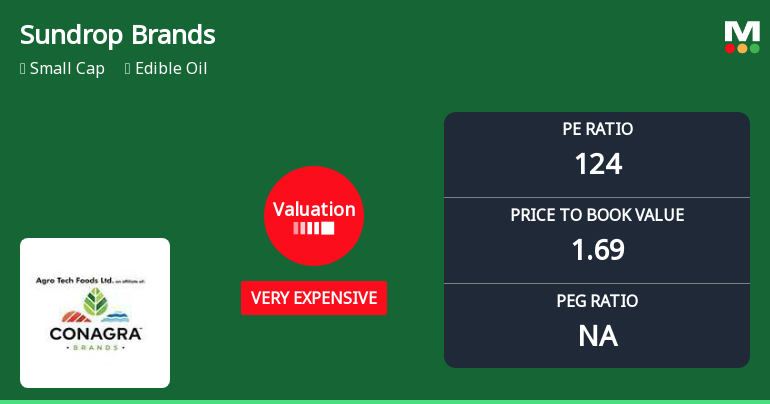
Sundrop Brands Ltd Valuation Shifts Signal Heightened Price Risk Amid Sector Challenges
Sundrop Brands Ltd has witnessed a marked shift in its valuation parameters, moving from an expensive to a very expensive rating, driven primarily by a surge in its price-to-earnings (P/E) ratio to 124.42. This change comes amid subdued financial returns and a challenging market environment, prompting a downgrade in its Mojo Grade from Hold to Sell as of 8 April 2026.
Read full news article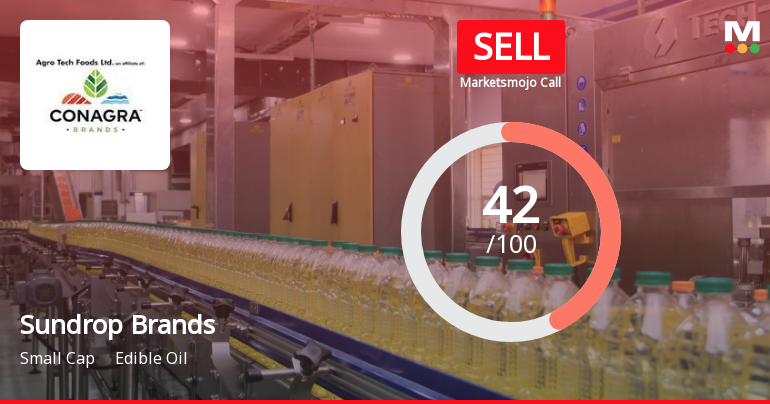
Sundrop Brands Ltd is Rated Sell
Sundrop Brands Ltd is rated 'Sell' by MarketsMOJO, with this rating last updated on 08 May 2026. However, the analysis and financial metrics discussed here reflect the stock's current position as of 03 June 2026, providing investors with the latest insights into the company’s performance and outlook.
Read full news article Announcements
Disclosures under Reg. 29(2) of SEBI (SAST) Regulations 2011
12-Jun-2026 | Source : BSEThe Exchange has received the disclosure under Regulation 29(2) of SEBI (Substantial Acquisition of Shares & Takeovers) Regulations 2011 for Catalyst Trusteeship Ltd
Disclosures under Reg. 31(1) and 31(2) of SEBI (SAST) Regulations 2011.
12-Jun-2026 | Source : BSEThe Exchange has received Disclosure under Regulation 31(1) and 31(2) of SEBI (Substantial Acquisition of Shares & Takeovers) Regulations 2011 on June 11 2026 for CAG - Tech (Mauritius) Ltd
Announcement Under Regulation 30 (LODR) - Intimation Of Grant Of 130367 Employee Stock Options (Options) Under Agro Tech Foods Limited Employees Stock Option Plan 2024 By Nomination And Remuneration Committee
07-Jun-2026 | Source : BSEIntimation of grant of 130367 Options under Agro Tech Foods Limited Employees Stock Option Plan 2024 as approved by the Nomination and Remuneration Committee by way of resolution passed by circulation today on June 07 2026 in supersession of its earlier approval accorded for grant of 154367 Options accorded on May 07 2026.
Corporate Actions

No Upcoming Board Meetings

Sundrop Brands Ltd has declared 30% dividend, ex-date: 20 Sep 24

No Splits history available

No Bonus history available

No Rights history available
Quality key factors
Valuation key factors
Technicals key factors
 Technical Indicator Scale: Bearish, Mildly Bearish, Sideways, Mildly Bullish, Bullish Turned
 Shareholding Snapshot : Mar 2026
Shareholding Compare (%holding)
Non Institution
100
Held by 3 Schemes (4.92%)
Held by 7 FIIs (0.23%)
Cag Tech Mauritius Limited (33.92%)
Dmpl India Limited (14.39%)
18.38%
Quarterly Results Snapshot (Consolidated) - Mar'26 - QoQ

QoQ Growth in quarter ended Mar 2026 is -5.13% vs 6.31% in Dec 2025
QoQ Growth in quarter ended Mar 2026 is 22.21% vs 485.65% in Dec 2025
Half Yearly Results Snapshot (Consolidated) - Sep'25

Growth in half year ended Sep 2025 is 95.35% vs -0.45% in Sep 2024
Growth in half year ended Sep 2025 is 788.00% vs -96.10% in Sep 2024
Nine Monthly Results Snapshot (Consolidated) - Dec'25
YoY Growth in nine months ended Dec 2025 is 95.44% vs 2.36% in Dec 2024
YoY Growth in nine months ended Dec 2025 is 147.12% vs -53.42% in Dec 2024
Annual Results Snapshot (Consolidated) - Mar'26
YoY Growth in year ended Mar 2026 is 72.38% vs 18.32% in Mar 2025
YoY Growth in year ended Mar 2026 is 118.32% vs -1,155.62% in Mar 2025
About Sundrop Brands Ltd

Company Coordinates


