
Compare Sungold Capital with Similar Stocks
Dashboard
With a Operating Losses, the company has a Weak Long Term Fundamental Strength
- Poor long term growth as Net Sales has grown by an annual rate of -3.07%
Flat results in Mar 26
With ROE of 0.2, it has a Expensive valuation with a 0.3 Price to Book Value
Consistent Underperformance against the benchmark over the last 3 years
Stock DNA
Non Banking Financial Company (NBFC)
INR 6 Cr (Micro Cap)
114.00
21
0.00%
0.00
0.23%
0.25
Total Returns (Price + Dividend) 
Sungold Capital for the last several years.
Risk Adjusted Returns v/s
Returns Beta

News

Sungold Capital Ltd Downgraded to Strong Sell Amidst Weak Fundamentals and Mixed Technicals
Sungold Capital Ltd, a micro-cap player in the Non Banking Financial Company (NBFC) sector, has seen its investment rating downgraded from Sell to Strong Sell as of 11 May 2026. This shift reflects a complex interplay of deteriorating financial fundamentals, challenging valuation metrics, and a nuanced technical outlook that collectively weigh on the stock’s prospects.
Read full news article
Sungold Capital Ltd Upgraded to Sell on Technical Improvements Despite Flat Financials
Sungold Capital Ltd, a micro-cap player in the Non Banking Financial Company (NBFC) sector, has seen its investment rating upgraded from Strong Sell to Sell as of 4 May 2026. This change is primarily driven by a shift in technical indicators signalling a mildly bullish trend, despite the company’s ongoing financial challenges and valuation concerns. The nuanced upgrade reflects a complex interplay of quality, valuation, financial trend, and technical parameters that investors should carefully consider.
Read full news article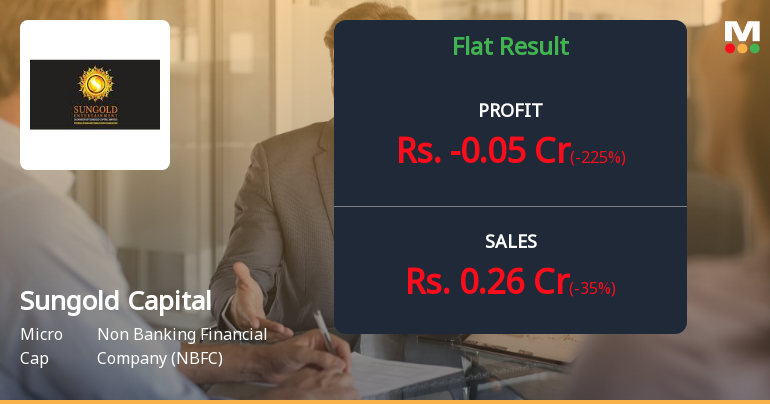
Sungold Capital Q4 FY26: Mounting Losses Deepen as Margins Collapse
Sungold Capital Ltd., a micro-cap non-banking financial company, reported a flat net profit of ₹0.00 crores in Q4 FY26, marking a concerning deterioration from the ₹0.04 crores reported in Q3 FY26. The company's operating performance has significantly weakened, with operating profit (PBDIT) plunging into negative territory at ₹-0.08 crores, compared to ₹0.05 crores in the previous quarter. With a market capitalisation of just ₹7.00 crores and trading at ₹3.80 per share, the stock has gained 3.26% in the most recent session, though fundamental challenges remain deeply entrenched.
Read full news article Announcements
Announcement under Regulation 30 (LODR)-Newspaper Publication
05-Jun-2026 | Source : BSENewspaper Publication of notice of AGM E-Voting facility and Book Closure.
Reg. 34 (1) Annual Report.
04-Jun-2026 | Source : BSENotice of 34th Annual General Meeting and Annual Report for FY 2025-2026
Book Closure And Cut-Off Date For 34Th Annual General Meeting
04-Jun-2026 | Source : BSEThe Company has fixed Book Closure Period from Wednesday 24.06.2026 to Tuesday 30.06.2026 (both days inclusive) and Cut-off date Tuesday 23.06.2026 for the purpose of 34th Annual General Meeting.
Corporate Actions

No Upcoming Board Meetings

No Dividend history available

No Splits history available

No Bonus history available

No Rights history available
Quality key factors
Valuation key factors
Technicals key factors
 Technical Indicator Scale: Bearish, Mildly Bearish, Sideways, Mildly Bullish, Bullish Turned
 Shareholding Snapshot : Mar 2026
Shareholding Compare (%holding)
Non Institution
None
Held by 0 Schemes
Held by 0 FIIs
Rajiv Rameshchandra Kotia (11.13%)
Shree Krishna Chalet And Organic Farms Private Limited (4.93%)
54.53%
Quarterly Results Snapshot (Standalone) - Mar'26 - QoQ

QoQ Growth in quarter ended Mar 2026 is -35.00% vs -11.11% in Dec 2025
QoQ Growth in quarter ended Mar 2026 is -225.00% vs 100.00% in Dec 2025
Half Yearly Results Snapshot (Standalone) - Sep'25
Growth in half year ended Sep 2025 is -27.27% vs -6.20% in Sep 2024
Growth in half year ended Sep 2025 is -14.29% vs 40.00% in Sep 2024
Nine Monthly Results Snapshot (Standalone) - Dec'25
YoY Growth in nine months ended Dec 2025 is -22.42% vs -6.78% in Dec 2024

YoY Growth in nine months ended Dec 2025 is 25.00% vs 14.29% in Dec 2024
Annual Results Snapshot (Standalone) - Mar'26
YoY Growth in year ended Mar 2026 is -24.39% vs -10.09% in Mar 2025
YoY Growth in year ended Mar 2026 is 0.00% vs 33.33% in Mar 2025
About Sungold Capital Ltd

Company Coordinates


