
Compare Sunil Healthcare with Similar Stocks
Dashboard
Weak Long Term Fundamental Strength with a -0.58% CAGR growth in Net Sales over the last 5 years
- Low ability to service debt as the company has a high Debt to EBITDA ratio of 4.37 times
- The company has been able to generate a Return on Equity (avg) of 6.15% signifying low profitability per unit of shareholders funds
Flat results in Mar 26
Stock DNA
Pharmaceuticals & Biotechnology
INR 73 Cr (Micro Cap)
18.00
35
0.00%
0.77
5.95%
1.05
Total Returns (Price + Dividend) 
Sunil Healthcare for the last several years.
Risk Adjusted Returns v/s
Returns Beta

News
Sunil Healthcare Ltd Upgraded to Sell on Technical Improvements Despite Weak Fundamentals
Sunil Healthcare Ltd has seen its investment rating upgraded from Strong Sell to Sell as of 12 June 2026, driven primarily by a shift in technical indicators despite persistent fundamental weaknesses. The micro-cap pharmaceutical company’s Mojo Score improved to 31.0, reflecting a nuanced market view amid flat financial performance and ongoing valuation challenges.
Read full news article
Sunil Healthcare Ltd Downgraded to Strong Sell Amid Weak Fundamentals and Bearish Technicals
Sunil Healthcare Ltd has been downgraded from a Sell to a Strong Sell rating as of 5 June 2026, reflecting deteriorating technical indicators and persistently weak financial fundamentals. The pharmaceutical micro-cap’s current Mojo Score stands at 26.0, underscoring significant concerns across quality, valuation, financial trends, and technicals that have prompted this decisive rating change.
Read full news article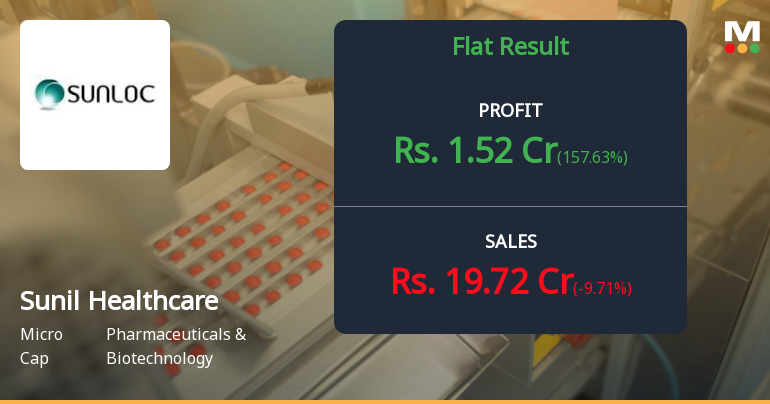
Sunil Healthcare Q4 FY26: Profitability Returns Amid Revenue Headwinds
Sunil Healthcare Limited, India's second-largest manufacturer of empty hard gelatin capsules, reported a remarkable turnaround in profitability for Q4 FY26, posting a net profit of ₹1.52 crores—a dramatic 322.22% surge year-on-year from ₹0.36 crores in Q4 FY25. However, this earnings recovery came against a backdrop of declining revenues, with quarterly sales dropping 6.98% YoY to ₹19.72 crores, raising questions about the sustainability of this profitability rebound. The stock, trading at ₹63.50 with a market capitalisation of ₹67.00 crores, has declined 6.19% following the results announcement, reflecting investor scepticism about the company's growth trajectory.
Read full news article Announcements
Announcement under Regulation 30 (LODR)-Newspaper Publication
31-May-2026 | Source : BSECopy of newspaper publication dated 31.05.2026 of the financial results for the quarter/year ended 31.03.206
Compliances-Reg.24(A)-Annual Secretarial Compliance
30-May-2026 | Source : BSEAnnual Secretarial Compliance Report for the Financial year 2025-26
Board Meeting Outcome for Outcome Of The 269Th Board Meeting Of The Company Held On 29.05.2026.
29-May-2026 | Source : BSEOutcome of the 269th Board Meeting of the Company held on 29.05.2026
Corporate Actions

No Upcoming Board Meetings

No Dividend history available

No Splits history available

No Bonus history available

No Rights history available
Quality key factors
Valuation key factors
Technicals key factors
 Technical Indicator Scale: Bearish, Mildly Bearish, Sideways, Mildly Bullish, Bullish Turned
 Shareholding Snapshot : Mar 2026
Shareholding Compare (%holding)
Promoters
None
Held by 0 Schemes
Held by 0 FIIs
Anil Kumar Khaitan (57.95%)
Shailesh Kumar (6.43%)
17.84%
Quarterly Results Snapshot (Consolidated) - Mar'26 - QoQ

QoQ Growth in quarter ended Mar 2026 is -9.71% vs -7.14% in Dec 2025

QoQ Growth in quarter ended Mar 2026 is 157.63% vs -41.00% in Dec 2025
Half Yearly Results Snapshot (Consolidated) - Sep'25
Growth in half year ended Sep 2025 is 10.56% vs -9.65% in Sep 2024
Growth in half year ended Sep 2025 is 253.23% vs 28.74% in Sep 2024
Nine Monthly Results Snapshot (Consolidated) - Dec'25
YoY Growth in nine months ended Dec 2025 is 9.31% vs -9.68% in Dec 2024
YoY Growth in nine months ended Dec 2025 is 239.89% vs 8.25% in Dec 2024
Annual Results Snapshot (Consolidated) - Mar'26
YoY Growth in year ended Mar 2026 is 5.15% vs -7.51% in Mar 2025
YoY Growth in year ended Mar 2026 is 382.39% vs 20.67% in Mar 2025
About Sunil Healthcare Ltd

Company Coordinates


