Sunil Healthcare

  • Market Cap: Micro Cap
  • Industry: Pharmaceuticals & Biotechnology
  • ISIN: INE671C01016
  • NSEID: SUNLOC
  • BSEID: 537253
INR
73.00
-0.49 (-0.67%)
BSENSE

Sep 21, 03:30 PM

BSE+NSE Vol: 7

  • Price Points
  • Score
  • Mojo Parameters
  • Total Return
  • News and Corporate Actions
  • Key factors
  • Shareholding
  • Financials
  • CompanyCV
stock-summaryPrice Point
High/Low

1Day

52 Week

Valuation
Technical
Day's Volume

CASH

7 (-82.50%) Volume

Shareholding (Jun 2026)

FII

0.00%

Held by 0 FIIs

DII

0.10%

Held by 0 DIIs

Promoter

73.53%

Why is Sunil Healthcare Ltd falling/rising?

06-Sep-2026

As of 05-Sep, Sunil Healthcare Ltd's stock price is rising to Rs 79.99, up 2.3%, and has gained 17.63% over the past month. Despite a decline in investor participation, the stock's strong performance relative to the Sensex indicates a bullish sentiment.

As of 05-Sep, Sunil Healthcare Ltd's stock price is rising, currently at Rs 79.99, which reflects a change of 1.8 (2.3%) upward. This increase is supported by the stock's strong performance relative to the benchmark Sensex, outperforming it by 2.75% today. Over the past month, the stock has shown a significant gain of 17.63%, while the Sensex has declined by 2.44%. Year-to-date, Sunil Healthcare has increased by 10.25%, contrasting with the Sensex's drop of 10.21%. <BR><BR>Additionally, the stock is trading above its moving averages across various time frames, indicating a positive trend. However, it is important to note that there has been a decline in investor participation, with delivery volume dropping by 77.59% compared to the 5-day average. Despite this decrease in trading activity, the overall performance metrics suggest a bullish sentiment towards Sunil Healthcare Ltd, contributing to the rise in its stock price.

View full answer

Should I buy, sell or hold Sunil Healthcare Ltd?

04-Sep-2026

Who are in the management team of Sunil Healthcare?

01-Sep-2026

The management team of Sunil Healthcare includes Anil Kumar Khaitan (Chairman & Managing Director), Sanjay Kumar Kaushik (Non-Executive Director), and several other directors and company secretaries responsible for the company's strategic direction and governance.

The management team of Sunil Healthcare includes the following key members:<BR><BR>1. **Anil Kumar Khaitan** - Chairman & Managing Director<BR>2. **Sanjay Kumar Kaushik** - Non-Executive Director<BR>3. **Rakesh Mohan** - Non-Executive & Independent Director<BR>4. **Santosh Kumar Sharma** - Company Secretary<BR>5. **Harish Pal Kumar** - Non-Executive & Independent Director<BR>6. **Krishna Venkatachalam Ranjan** - Non-Executive & Non-Independent Director<BR>7. **Mudita Chaturvedi** - Additional Non-Executive Director<BR>8. **Bejon Kumar Misra** - Non-Executive & Independent Director<BR>9. **Satyendu Pattnaik** - Company Secretary & Compliance Officer<BR><BR>This team is responsible for overseeing the strategic direction and governance of the company.

View full answer

What does Sunil Healthcare do?

01-Sep-2026

Sunil Healthcare Ltd is a manufacturer of Empty Hard Gelatin and HPMC Capsules, established in 1973 and recognized as India's second-largest producer in this sector. As of June 2026, it reported net sales of 19 Cr and a market cap of INR 77 Cr.

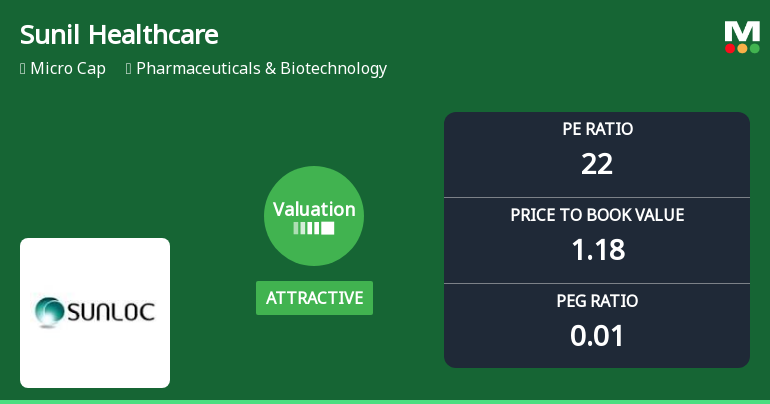
Overview:<BR>Sunil Healthcare Ltd is a manufacturer of Empty Hard Gelatin Capsule Shells and HPMC Capsules Shell, operating within the Pharmaceuticals & Biotechnology industry and classified as a Micro Cap company.<BR><BR>History:<BR>Incorporated in 1973, Sunil Healthcare Ltd was formerly known as Sunil Synchem Ltd. The company has established itself as the second-largest manufacturer of Empty Hard Gelatin Capsules in India. The latest quarterly results reported net sales and profit for June 2026.<BR><BR>Financial Snapshot:<BR>Net Sales: 19 Cr (Quarterly Results - Jun 2026) <BR>Net Profit: 0 Cr (Quarterly Results - Jun 2026) <BR>Market Cap: INR 77 Cr (Micro Cap)<BR><BR>Key Metrics:<BR>P/E: 22.00 <BR>Industry P/E: 37 <BR>Dividend Yield: 0.00% <BR>Debt-Equity: 0.77 <BR>Return on Equity: 5.95% <BR>Price to Book: 1.18 <BR><BR>Contact Details:<BR>Address: 38E/252-A 1st Flr, Vijay Tower Shahpurjat New Delhi New Delhi : 110049 <BR>Tel: 91-11-49435555 <BR>Email: info@sunilhealthcare.com <BR>Website: http://www.sunilhealthcare.com

View full answer

Who are the peers of the Sunil Healthcare?

01-Sep-2026

Sunil Healthcare's peers include Asston Pharmaceu, Veerhealth Care, Mercury Labs, Amwill Health, Vineet Laborator, Samrat Pharma, Source Natural, Bharat Immunolog, and Onyx Biotec. Sunil Healthcare has below-average management risk, good growth, and a 1-year return of 10.32%.

Peers: The peers of Sunil Healthcare are Asston Pharmaceu, Veerhealth Care, Mercury Labs, Amwill Health, Vineet Laborator, Samrat Pharma, Source Natural, Bharat Immunolog, and Onyx Biotec.<BR><BR>Quality Snapshot: Excellent management risk is observed at Amwill Health, while Good management risk is found at Source Natural. Average management risk is present at Asston Pharmaceu, Mercury Labs, and Samrat Pharma, while Below Average management risk is noted at Veerhealth Care, Vineet Laborator, Sunil Healthcare, Bharat Immunolog, and Zenith Drugs. Growth is Good at Veerhealth Care and Sunil Healthcare, Average at Amwill Health, and Below Average at Asston Pharmaceu, Mercury Labs, Vineet Laborator, Samrat Pharma, Source Natural, Bharat Immunolog, and Zenith Drugs. Capital Structure is Excellent at Mercury Labs and Amwill Health, Average at Asston Pharmaceu and Onyx Biotec, and Below Average at Veerhealth Care, Vineet Laborator, Sunil Healthcare, Samrat Pharma, Source Natural, and Bharat Immunolog.<BR><BR>Return Snapshot: Veerhealth Care has the highest 1-year return at 157.30%, while Bharat Immunolog has the lowest at -27.90%. Sunil Healthcare's 1-year return of 10.32% is higher than Bharat Immunolog's but lower than Veerhealth Care's. Additionally, Mercury Labs, Samrat Pharma, Bharat Immunolog, and Onyx Biotec have negative six-month returns.

View full answer

How big is Sunil Healthcare?

01-Sep-2026

As of 31st August, Sunil Healthcare Ltd has a market capitalization of 77.00 Cr, with recent net sales of 84.07 Cr and a net profit of 3.57 Cr. The latest balance sheet shows shareholder's funds of 67.07 Cr and total assets of 161.94 Cr.

As of 31st August, Sunil Healthcare Ltd has a market capitalization of 77.00 Cr, categorizing it as a Micro Cap company.<BR><BR>In the latest four quarters, Sunil Healthcare reported Net Sales of 84.07 Cr and a Net Profit of 3.57 Cr.<BR><BR>The latest annual period for the balance sheet is March 2025, showing Shareholder's Funds of 67.07 Cr and Total Assets of 161.94 Cr.

View full answer

Are Sunil Healthcare Ltd latest results good or bad?

13-Aug-2026

Sunil Healthcare Ltd's latest results show a significant net profit increase of 322.22% year-on-year, largely due to a one-time tax reversal, but net sales declined by 6.98%, indicating ongoing operational challenges and concerns about financial sustainability. Investors should be cautious due to these underlying issues.

Sunil Healthcare Ltd's latest results present a mixed picture. On one hand, the company reported a significant increase in net profit for Q4 FY26, reaching ₹1.52 crore, which is a remarkable 322.22% increase year-on-year. However, this profit surge was largely driven by a one-time tax reversal of ₹2.46 crore, which masked underlying operational challenges.<BR><BR>On the other hand, net sales fell to ₹19.72 crore, marking a 6.98% decline year-on-year and a 9.71% drop from the previous quarter. This revenue contraction is particularly concerning as it indicates ongoing struggles in generating consistent sales, especially during a typically strong quarter.<BR><BR>Moreover, the operating margin has compressed to 9.84%, the lowest in eight quarters, reflecting deteriorating pricing power and operational efficiency. The company's ability to cover its interest payments has also weakened, with an operating profit to interest coverage ratio of just 1.17 times, raising concerns about financial sustainability.<BR><BR>In summary, while the net profit figure may seem positive at first glance, the overall operational performance reveals significant challenges that could jeopardize future growth. Investors should be cautious, as the underlying issues suggest that the company is facing a tough road ahead.

View full answer

When is the next results date for Sunil Healthcare Ltd?

20-May-2026

The next results date for Sunil Healthcare Ltd is 29 May 2026.

The next results date for Sunil Healthcare Ltd is scheduled for 29 May 2026.

View full answer

Is Sunil Healthcare overvalued or undervalued?

21-Nov-2025

As of November 20, 2025, Sunil Healthcare is considered overvalued with a high PE ratio of 42.04 and an EV to EBITDA of 10.06, despite a low PEG ratio of 0.18, indicating inefficiencies in capital utilization and underperformance compared to industry peers and the Sensex.

As of 20 November 2025, Sunil Healthcare's valuation grade has moved from very attractive to attractive, indicating a shift in its perceived value. The company is currently considered overvalued based on its high PE ratio of 42.04, which significantly exceeds the industry average. Additionally, its EV to EBITDA stands at 10.06, while its ROCE is only 5.00%, suggesting inefficiencies in capital utilization compared to peers.<BR><BR>In comparison to its industry peers, Sunil Healthcare's valuation metrics are notably higher; for instance, Sun Pharma has a PE ratio of 36.94 and an EV to EBITDA of 24.4, while Cipla, another attractive peer, has a PE of 22.72 and an EV to EBITDA of 16.07. The PEG ratio for Sunil Healthcare is also low at 0.18, indicating potential growth relative to its price, but this does not sufficiently offset the concerns raised by its high valuation ratios. Furthermore, the company's stock has underperformed relative to the Sensex over various time frames, including a year-to-date return of -9.08% compared to the Sensex's 9.59%.

View full answer

How has been the historical performance of Sunil Healthcare?

04-Nov-2025

Sunil Healthcare's historical performance shows a decline in net sales and profits, with net sales dropping from 110.49 Cr in Mar'23 to 83.42 Cr in Mar'25, and profit after tax turning negative from 6.68 Cr to -1.42 Cr. However, cash flow from operating activities improved from 7.00 Cr to 11.00 Cr during the same period.

Answer:<BR>The historical performance of Sunil Healthcare shows a fluctuating trend in key financial metrics over the years.<BR><BR>Breakdown:<BR>Sunil Healthcare's net sales have decreased from 110.49 Cr in Mar'23 to 83.42 Cr in Mar'25, reflecting a downward trend. The total operating income followed a similar pattern, dropping from 110.49 Cr in Mar'23 to 83.42 Cr in Mar'25. The company's total expenditure also declined from 94.33 Cr in Mar'23 to 73.16 Cr in Mar'25, indicating cost management efforts. Operating profit, which reached 20.66 Cr in Mar'23, fell to 11.60 Cr by Mar'25, while profit before tax transitioned from a positive 9.48 Cr in Mar'23 to a negative 1.22 Cr in Mar'25. Consequently, the profit after tax also turned negative, from 6.68 Cr in Mar'23 to -1.42 Cr in Mar'25. The company's total liabilities increased from 120.79 Cr in Mar'23 to 161.94 Cr in Mar'25, while total assets rose from 120.79 Cr to 161.94 Cr in the same period. Cash flow from operating activities showed improvement, moving from 7.00 Cr in Mar'23 to 11.00 Cr in Mar'25, despite the overall cash flow from financing activities being negative in Mar'25.

View full answer

What is the technical trend for Sunil Healthcare?

09-Jun-2025

As of June 6, 2025, Sunil Healthcare's technical trend is mildly bearish, influenced by daily moving averages and a monthly MACD, despite mixed signals from the weekly MACD and Bollinger Bands.

As of 6 June 2025, the technical trend for Sunil Healthcare has changed from sideways to mildly bearish. The weekly MACD is mildly bullish, but the monthly MACD is mildly bearish, indicating mixed signals. The daily moving averages are mildly bearish, reinforcing the bearish stance. Bollinger Bands show a bullish signal on the weekly but a mildly bearish signal on the monthly, adding to the complexity. The KST is mildly bullish weekly but mildly bearish monthly, and there are no clear trends indicated by Dow Theory. Overall, the current stance is mildly bearish, driven primarily by the daily moving averages and the monthly MACD.

View full answer

Who are the top shareholders of the Sunil Healthcare?

06-Jun-2025

The top shareholder of Sunil Healthcare is Anil Kumar Khaitan, who holds 57.95% of the shares. The highest public shareholder is Shailesh Kumar with 5.86%, while individual investors collectively own 17.85%.

The top shareholders of Sunil Healthcare are primarily the promoters, with Anil Kumar Khaitan holding the largest share at 57.95%. There are no pledged promoter holdings, and the company does not have any mutual funds or foreign institutional investors (FIIs) holding shares. The highest public shareholder is Shailesh Kumar, who owns 5.86% of the shares. Additionally, individual investors collectively hold 17.85% of the company's shares.

View full answer

Has Sunil Healthcare declared dividend?

06-Jun-2025

No Dividend History Available

iScoreScore
Click here to find our call on this stock
Strong Sell
Sell
Hold
Buy
Strong Buy

Dashboard

1

Weak Long Term Fundamental Strength with a -2.45% CAGR growth in Net Sales over the last 5 years

  • Low ability to service debt as the company has a high Debt to EBITDA ratio of 4.37 times
  • The company has been able to generate a Return on Equity (avg) of 6.15% signifying low profitability per unit of shareholders funds
2

Flat results in Jun 26

stock-summaryMojo Parameters

Mojo Parameters

Loading Valuation Snapshot...

Stock DNA

stock-summary
Industry

Pharmaceuticals & Biotechnology

stock-summary
Market cap

INR Cr (Micro Cap)

stock-summary
P/E

20.00

stock-summary
Industry P/E

NA

stock-summary
Dividend Yield

0.00%

stock-summary
Debt Equity

0.00

stock-summary
Return on Equity

0.00%

stock-summary
Price to Book

0.00

Revenue and Profits:
Net Sales:
19 Cr
(Quarterly Results - Jun 2026)
Net Profit:
0 Cr
stock-summaryTotal Returns
Total Returns (Price + Dividend) stock-summary
Icon
Company does not have enough history
Risk Adjusted Returns v/s stock-summary
Returns Beta
Icon
Beta has not been calculated since enough price history is not available
stock-summaryNews & Corporate Actions

News

Announcements stock-summary

Icon
No announcement available

Corporate Actions stock-summary

stock-summary
BOARD MEETING

No Upcoming Board Meetings

stock-summary
DIVIDEND

No Dividend history available

stock-summary
SPLITS

No Splits history available

stock-summary
BONUS

No Bonus history available

stock-summary
RIGHTS

No Rights history available

stock-summaryKey Factors

Quality key factors stock-summary

Factor
Value
Sales Growth (5y)
-2.45%
EBIT Growth (5y)
51.50%
EBIT to Interest (avg)
1.41
Debt to EBITDA (avg)
6.19
Net Debt to Equity (avg)
0.77
Sales to Capital Employed (avg)
0.95
Tax Ratio
Tax Ratio is Negative%
Dividend Payout Ratio
0
Pledged Shares
0
Institutional Holding
0.10%
ROCE (avg)
5.52%
ROE (avg)
6.15%

Valuation key factors

Factor
Value
P/E Ratio
20
Industry P/E
27
Price to Book Value
1.08
EV to EBIT
20.87
EV to EBITDA
10.38
EV to Capital Employed
1.05
EV to Sales
1.53
PEG Ratio
0.01
Dividend Yield
NA
ROCE (Latest)
5.14%
ROE (Latest)
5.95%

Technicals key factors

Indicator
Weekly
Monthly
MACD
Bullish
Mildly Bullish
RSI
No Signal
No Signal
Bollinger Bands
Mildly Bullish
Mildly Bullish
Moving Averages
Bullish (Daily)
KST
Bullish
Bearish
Dow Theory
Mildly Bullish
Mildly Bullish
OBV
No Trend
No Trend
stock-summary Technical Indicator Scale: Bearish, Mildly Bearish, Sideways, Mildly Bullish, Bullish  Turned 
stock-summaryShareholding
Shareholding Snapshot : Jun 2026stock-summary
Shareholding Compare (%holding) stock-summary
Majority shareholders

Promoters

Pledged Promoter Holdings

None

Mutual Funds

Held by 0 Schemes

FIIs

Held by 0 FIIs

Promoter with highest holding

Anil Kumar Khaitan (57.95%)

Highest Public shareholder

Shailesh Kumar (6.6%)

Individual Investors Holdings

17.89%

stock-summaryFinancial
[
  {
    "link": "quarterly",
    "btn_text": "All Quarterly Results",
    "header": "Quarterly Results Snapshot (Consolidated) - Jun'26 - QoQ",
    "rhs": [
      {
        "prefix": "Net Sales ",
        "suffix": "QoQ Growth in quarter ended Jun 2026 is -3.70% vs -9.71% in Mar 2026",
        "dir": 1
      },
      {
        "prefix": "Consolidated Net Profit ",
        "suffix": "QoQ Growth in quarter ended Jun 2026 is -69.74% vs 157.63% in Mar 2026",
        "dir": -1
      }
    ],
    "table": {
      "header": [
        "Jun'26",
        "Mar'26",
        "Change(%)"
      ],
      "body": [
        {
          "field": "Net Sales",
          "val1": "18.99",
          "val2": "19.72",
          "chgp": "-3.70%",
          "chgp_class": "negative"
        },
        {
          "field": "Operating Profit (PBDIT) excl Other Income",
          "val1": "2.93",
          "val2": "1.94",
          "chgp": "51.03%",
          "chgp_class": "positive"
        },
        {
          "field": "Interest",
          "val1": "1.50",
          "val2": "1.66",
          "chgp": "-9.64%",
          "chgp_class": "positive"
        },
        {
          "field": "Exceptional Items",
          "val1": "0.00",
          "val2": "-0.12",
          "chgp": "100.00%",
          "chgp_class": "positive"
        },
        {
          "field": "Consolidate Net Profit",
          "val1": "0.46",
          "val2": "1.52",
          "chgp": "-69.74%",
          "chgp_class": "negative"
        },
        {
          "field": "Operating Profit Margin (Excl OI)",
          "val1": "15.43%",
          "val2": "9.84%",
          "chgp": "5.59%",
          "chgp_class": "positive"
        }
      ]
    }
  },
  {
    "link": "half-yearly",
    "btn_text": "All Half Yearly Results",
    "header": "Half Yearly Results Snapshot (Consolidated) - Sep'25",
    "rhs": [
      {
        "prefix": "Net Sales ",
        "suffix": " Growth in half year ended Sep 2025 is 10.56% vs -9.65% in Sep 2024",
        "dir": 1
      },
      {
        "prefix": "Consolidated Net Profit ",
        "suffix": " Growth in half year ended Sep 2025 is 253.23% vs 28.74% in Sep 2024",
        "dir": 1
      }
    ],
    "table": {
      "header": [
        "Sep'25",
        "Sep'24",
        "Change(%)"
      ],
      "body": [
        {
          "field": "Net Sales",
          "val1": "46.16",
          "val2": "41.75",
          "chgp": "10.56%",
          "chgp_class": "positive"
        },
        {
          "field": "Operating Profit (PBDIT) excl Other Income",
          "val1": "7.20",
          "val2": "4.52",
          "chgp": "59.29%",
          "chgp_class": "positive"
        },
        {
          "field": "Interest",
          "val1": "2.84",
          "val2": "3.01",
          "chgp": "-5.65%",
          "chgp_class": "positive"
        },
        {
          "field": "Exceptional Items",
          "val1": "0.00",
          "val2": "0.00",
          "chgp": "",
          "chgp_class": "neutral"
        },
        {
          "field": "Consolidate Net Profit",
          "val1": "1.90",
          "val2": "-1.24",
          "chgp": "253.23%",
          "chgp_class": "positive"
        },
        {
          "field": "Operating Profit Margin (Excl OI)",
          "val1": "15.60%",
          "val2": "10.83%",
          "chgp": "4.77%",
          "chgp_class": "positive"
        }
      ]
    }
  },
  {
    "link": "nine-monthly",
    "btn_text": "All Nine Monthly Results",
    "header": "Nine Monthly Results Snapshot (Consolidated) - Dec'25",
    "rhs": [
      {
        "prefix": "Net Sales ",
        "suffix": "YoY Growth in nine months ended Dec 2025 is 9.31% vs -9.68% in Dec 2024",
        "dir": 1
      },
      {
        "prefix": "Consolidated Net Profit ",
        "suffix": "YoY Growth in nine months ended Dec 2025 is 239.89% vs 8.25% in Dec 2024",
        "dir": 1
      }
    ],
    "table": {
      "header": [
        "Dec'25",
        "Dec'24",
        "Change(%)"
      ],
      "body": [
        {
          "field": "Net Sales",
          "val1": "68.00",
          "val2": "62.21",
          "chgp": "9.31%",
          "chgp_class": "positive"
        },
        {
          "field": "Operating Profit (PBDIT) excl Other Income",
          "val1": "10.83",
          "val2": "7.22",
          "chgp": "50.00%",
          "chgp_class": "positive"
        },
        {
          "field": "Interest",
          "val1": "4.50",
          "val2": "4.90",
          "chgp": "-8.16%",
          "chgp_class": "positive"
        },
        {
          "field": "Exceptional Items",
          "val1": "0.00",
          "val2": "0.00",
          "chgp": "",
          "chgp_class": "neutral"
        },
        {
          "field": "Consolidate Net Profit",
          "val1": "2.49",
          "val2": "-1.78",
          "chgp": "239.89%",
          "chgp_class": "positive"
        },
        {
          "field": "Operating Profit Margin (Excl OI)",
          "val1": "15.93%",
          "val2": "11.61%",
          "chgp": "4.32%",
          "chgp_class": "positive"
        }
      ]
    }
  },
  {
    "link": "annual",
    "btn_text": "All Annual Results",
    "header": "Annual Results Snapshot (Consolidated) - Mar'26",
    "rhs": [
      {
        "prefix": "Net Sales ",
        "suffix": "YoY Growth in year ended Mar 2026 is 5.15% vs -7.51% in Mar 2025",
        "dir": 1
      },
      {
        "prefix": "Consolidated Net Profit ",
        "suffix": "YoY Growth in year ended Mar 2026 is 382.39% vs 20.67% in Mar 2025",
        "dir": 1
      }
    ],
    "table": {
      "header": [
        "Mar'26",
        "Mar'25",
        "Change(%)"
      ],
      "body": [
        {
          "field": "Net Sales",
          "val1": "87.72",
          "val2": "83.42",
          "chgp": "5.15%",
          "chgp_class": "positive"
        },
        {
          "field": "Operating Profit (PBDIT) excl Other Income",
          "val1": "12.77",
          "val2": "10.26",
          "chgp": "24.46%",
          "chgp_class": "positive"
        },
        {
          "field": "Interest",
          "val1": "6.16",
          "val2": "6.46",
          "chgp": "-4.64%",
          "chgp_class": "positive"
        },
        {
          "field": "Exceptional Items",
          "val1": "-0.12",
          "val2": "0.00",
          "chgp": "",
          "chgp_class": "neutral"
        },
        {
          "field": "Consolidate Net Profit",
          "val1": "4.01",
          "val2": "-1.42",
          "chgp": "382.39%",
          "chgp_class": "positive"
        },
        {
          "field": "Operating Profit Margin (Excl OI)",
          "val1": "14.56%",
          "val2": "12.30%",
          "chgp": "2.26%",
          "chgp_class": "positive"
        }
      ]
    }
  }
]

Quarterly Results Snapshot (Consolidated) - Jun'26 - QoQstock-summary

Jun'26
Mar'26
Change(%)
Net Sales
18.99
19.72
-3.70%
Operating Profit (PBDIT) excl Other Income
2.93
1.94
51.03%
Interest
1.50
1.66
-9.64%
Exceptional Items
0.00
-0.12
100.00%
Consolidate Net Profit
0.46
1.52
-69.74%
Operating Profit Margin (Excl OI)
15.43%
9.84%
5.59%
Values in Rs Cr.
Direction Arrows
Net Sales

QoQ Growth in quarter ended Jun 2026 is -3.70% vs -9.71% in Mar 2026

Direction Arrows
Consolidated Net Profit

QoQ Growth in quarter ended Jun 2026 is -69.74% vs 157.63% in Mar 2026

Half Yearly Results Snapshot (Consolidated) - Sep'25stock-summary

Sep'25
Sep'24
Change(%)
Net Sales
46.16
41.75
10.56%
Operating Profit (PBDIT) excl Other Income
7.20
4.52
59.29%
Interest
2.84
3.01
-5.65%
Exceptional Items
0.00
0.00
Consolidate Net Profit
1.90
-1.24
253.23%
Operating Profit Margin (Excl OI)
15.60%
10.83%
4.77%
Values in Rs Cr.
Direction Arrows
Net Sales

Growth in half year ended Sep 2025 is 10.56% vs -9.65% in Sep 2024

Direction Arrows
Consolidated Net Profit

Growth in half year ended Sep 2025 is 253.23% vs 28.74% in Sep 2024

Nine Monthly Results Snapshot (Consolidated) - Dec'25stock-summary

Dec'25
Dec'24
Change(%)
Net Sales
68.00
62.21
9.31%
Operating Profit (PBDIT) excl Other Income
10.83
7.22
50.00%
Interest
4.50
4.90
-8.16%
Exceptional Items
0.00
0.00
Consolidate Net Profit
2.49
-1.78
239.89%
Operating Profit Margin (Excl OI)
15.93%
11.61%
4.32%
Values in Rs Cr.
Direction Arrows
Net Sales

YoY Growth in nine months ended Dec 2025 is 9.31% vs -9.68% in Dec 2024

Direction Arrows
Consolidated Net Profit

YoY Growth in nine months ended Dec 2025 is 239.89% vs 8.25% in Dec 2024

Annual Results Snapshot (Consolidated) - Mar'26stock-summary

Mar'26
Mar'25
Change(%)
Net Sales
87.72
83.42
5.15%
Operating Profit (PBDIT) excl Other Income
12.77
10.26
24.46%
Interest
6.16
6.46
-4.64%
Exceptional Items
-0.12
0.00
Consolidate Net Profit
4.01
-1.42
382.39%
Operating Profit Margin (Excl OI)
14.56%
12.30%
2.26%
Values in Rs Cr.
Direction Arrows
Net Sales

YoY Growth in year ended Mar 2026 is 5.15% vs -7.51% in Mar 2025

Direction Arrows
Consolidated Net Profit

YoY Growth in year ended Mar 2026 is 382.39% vs 20.67% in Mar 2025

stock-summaryCompany CV
About Sunil Healthcare Ltd stock-summary
stock-summary
Sunil Healthcare Ltd
Micro Cap
Pharmaceuticals & Biotechnology
Sunil Healthcare Limited (Formerly known Sunil Synchem Ltd) was incorporated in 1973. The Company introduced plant at Alwar; Rajasthan for manufacture of Empty Hard Gelatin Capsule Shells and HPMC Capsules Shell. With continuous efforts and improvements in policy & adherence to top-notch quality monitoring measures, the Company became the second-largest manufacturer of Empty Hard Gelatin Capsules (EHGC) in India.
Company Coordinates stock-summary
Company Details
38E/252-A 1st Flr, Vijay Tower Shahpurjat New Delhi New Delhi : 110049
stock-summary
Tel: 91-11-49435555
stock-summary
info@sunilhealthcare.com
Registrar Details
Alankit Assignments Ltd , Alankit House , 2 E/21, Jhandewala Extension, New Delhi