
Compare Suntory Beverage & Food Ltd. with Similar Stocks
Dashboard
1
Company's ability to service its debt is strong with a healthy EBIT to Interest (avg) ratio of 45.44
2
Poor long term growth as Net Sales has grown by an annual rate of 5.55% and Operating profit at 5.92% over the last 5 years
3
Flat results in Jun 25
4
With ROE of 9.52%, it has a very attractive valuation with a 1.22 Price to Book Value
5
Majority shareholders : Non Institution
6
Underperformed the market in the last 1 year
Total Returns (Price + Dividend) 
TimePeriod
Price Return
Dividend Return
Total Return
3 Months
12639.47%
0%
12639.47%
6 Months
14138.24%
0%
14138.24%
1 Year
11277.2%
0%
11277.2%
2 Years
11371.56%
0%
11371.56%
3 Years
10469.87%
0%
10469.87%
4 Years
11379.72%
0%
11379.72%
5 Years
10803.15%
0%
10803.15%
Suntory Beverage & Food Ltd. for the last several years.
Risk Adjusted Returns v/s
News
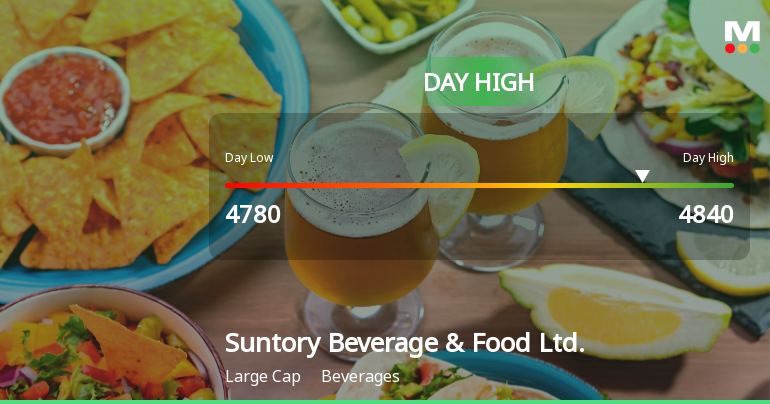
Suntory Beverage & Food Hits Day High with Strong 3.03% Gain
Suntory Beverage & Food has demonstrated notable performance, reaching an intraday high while contrasting with a decline in the Japan Nikkei 225. The company has shown resilience over the past week and month, despite a year-over-year decrease. Its financial metrics indicate strong debt management and solid market capitalization.
Read full news article Announcements

No announcement available
Corporate Actions
No corporate action available
Quality key factors
Factor
Value
Sales Growth (5y)
5.55%
EBIT Growth (5y)
5.92%
EBIT to Interest (avg)
45.44
Debt to EBITDA (avg)
Net Debt is too low
Net Debt to Equity (avg)
-0.08
Sales to Capital Employed (avg)
1.35
Tax Ratio
26.78%
Dividend Payout Ratio
39.66%
Pledged Shares
0
Institutional Holding
0.00%
ROCE (avg)
14.21%
ROE (avg)
9.46%
Valuation key factors
Factor
Value
P/E Ratio
13
Industry P/E
Price to Book Value
1.22
EV to EBIT
8.13
EV to EBITDA
5.50
EV to Capital Employed
1.24
EV to Sales
0.79
PEG Ratio
12.07
Dividend Yield
NA
ROCE (Latest)
15.23%
ROE (Latest)
9.52%
Technicals key factors
Indicator
Weekly
Monthly
MACD
Bullish
Bearish
RSI
No Signal
No Signal
Bollinger Bands
Mildly Bullish
Mildly Bearish
Moving Averages
Mildly Bullish (Daily)
KST
Mildly Bearish
Bearish
Dow Theory
Mildly Bullish
Mildly Bullish
OBV
No Trend
Bullish
 Technical Indicator Scale: Bearish, Mildly Bearish, Sideways, Mildly Bullish, Bullish Turned
 Shareholding Snapshot : Sep 2025
Shareholding Compare (%holding)
Majority shareholders
Foreign Institutions
Domestic Funds
Held in 0 Schemes (0%)
Foreign Institutions
Held by 1 Foreign Institutions (0.0%)
Strategic Entities with highest holding
Highest Public shareholder
Quarterly Results Snapshot (Consolidated) - Jun'25 - YoY
Jun'25
Jun'24
Change(%)
Net Sales
440,629.00
445,703.00
-1.14%
Operating Profit (PBDIT) excl Other Income
65,733.00
66,525.00
-1.19%
Interest
1,618.00
1,352.00
19.67%
Exceptional Items
0.00
0.00
Consolidate Net Profit
31,528.00
33,383.00
-5.56%
Operating Profit Margin (Excl OI)
103.70%
107.20%
-0.35%
USD in Million.

Net Sales
YoY Growth in quarter ended Jun 2025 is -1.14% vs 8.20% in Jun 2024
Consolidated Net Profit
YoY Growth in quarter ended Jun 2025 is -5.56% vs 11.01% in Jun 2024
Annual Results Snapshot (Consolidated) - Dec'24
Dec'24
Dec'23
Change(%)
Net Sales
1,696,765.00
1,591,722.00
6.60%
Operating Profit (PBDIT) excl Other Income
245,870.00
217,674.00
12.95%
Interest
4,529.00
2,936.00
54.26%
Exceptional Items
-7,415.00
-2,247.00
-230.00%
Consolidate Net Profit
117,629.00
104,480.00
12.59%
Operating Profit Margin (Excl OI)
99.60%
90.80%
0.88%
USD in Million.
Net Sales
YoY Growth in year ended Dec 2024 is 6.60% vs 9.74% in Dec 2023

Consolidated Net Profit
YoY Growth in year ended Dec 2024 is 12.59% vs 3.34% in Dec 2023
About Suntory Beverage & Food Ltd.

Suntory Beverage & Food Ltd.
Beverages
No Details Available.
Company Coordinates
No Company Details Available
InfinHub Market Technologies FZ-LLC, Building-2, Unit 112, Dubai Internet City, Dubai, United Arab Emirates
GET THE MARKETSMOJO APP


Company
Stocks
Portfolio


"Investment in securities markets are subject to market risk. Read all the related documents carefully before investing."