Super Crop Safe

  • Market Cap: Micro Cap
  • Industry: Pesticides & Agrochemicals
  • ISIN: INE366G01022
  • NSEID:
  • BSEID: 530883
INR
8.15
0.12 (1.49%)
BSENSE

Dec 05

BSE+NSE Vol: 865

  • Price Points
  • Score
  • Mojo Parameters
  • Total Return
  • News and Corporate Actions
  • Key factors
  • Shareholding
  • Financials
  • CompanyCV
stock-summaryPrice Point
High/Low

1Day

52 Week

Valuation
Technical
Day's Volume

CASH

865 (88.86%) Volume

Shareholding (Sep 2025)

FII

0.00%

Held by 0 FIIs

DII

0.00%

Held by 0 DIIs

Promoter

32.72%

how big is Super Crop Safe?

06-Jun-2025

As of March 2024, Super Crop Safe Ltd has a market capitalization of 53.73 Cr, with net sales of 45.40 Cr and a net profit of 2.16 Cr over the latest four quarters. Shareholder's funds are valued at 27.06 Cr, and total assets amount to 87.87 Cr.

Market Cap: Super Crop Safe Ltd has a market capitalization of 53.73 Cr and is classified as a Micro Cap.<BR><BR>Recent Quarterly Performance: The sum of Net Sales for the latest 4 quarters is 45.40 Cr, and the sum of Net Profit for the latest 4 quarters is 2.16 Cr. This data is Standalone.<BR><BR>Balance Sheet Snapshot: This is Standalone data for the reporting period of March 2024. Shareholder's Funds are valued at 27.06 Cr, and Total Assets amount to 87.87 Cr.

Read More

Who are in the management team of Super Crop Safe?

06-Jun-2025

As of March 2022, the management team of Super Crop Safe includes Ishwarbhai B Patel (Chairman & CEO), Nishant N Patel (Managing Director & CFO), and several independent directors. Ishwarbhai B Patel and Nishant N Patel each receive a remuneration of Rs. 12.0 lacs.

As of March 2022, the management team of Super Crop Safe includes:<BR><BR>1. Ishwarbhai B Patel - Chairman & CEO<BR>2. Ambalal B Patel - Executive Director<BR>3. N R Krishna - Independent Director<BR>4. Kalpanaben J Pandya - Independent Director<BR>5. Hiral M Patel - Company Secretary & Compliance Officer<BR>6. Mahendra Singh Rao - Independent Director<BR>7. Nishant N Patel - Managing Director & CFO<BR><BR>Ishwarbhai B Patel and Nishant N Patel are the only members with remuneration listed, each receiving Rs. 12.0 lacs.

Read More

What does Super Crop Safe do?

06-Jun-2025

Super Crop Safe Ltd manufactures and supplies insecticides and fungicides in the agrochemicals industry. As of March 2025, it reported net sales of 10 Cr and a net loss of 1 Cr, with a market cap of Rs 55 Cr.

Overview: <BR>Super Crop Safe Ltd is engaged in the manufacturing and supplying of premium quality insecticides and fungicides within the pesticides and agrochemicals industry, categorized as a micro-cap company.<BR><BR>History: <BR>Incorporated in 1987, Super Crop Safe Ltd is based in Ahmadabad, Gujarat. The latest quarterly results reported net sales and net profit for the period ending March 2025.<BR><BR>Financial Snapshot: <BR>Most recent Net Sales: 10 Cr (Quarterly Results - Mar 2025) <BR>Most recent Net Profit: -1 Cr (Quarterly Results - Mar 2025) <BR>Market-cap value: Rs 55 Cr (Micro Cap)<BR><BR>Key Metrics: <BR>P/E: 26.00 <BR>Industry P/E: 38 <BR>Dividend Yield: 0.00% <BR>Debt Equity: 1.46 <BR>Return on Equity: 7.38% <BR>Price to Book: 1.88 <BR><BR>Contact Details: <BR>Address: C-1/290 GIDC Estate, Phase I Naroda Ahmedabad Gujarat : 382330 <BR>Tel: 91-079-22823907 / 9824169514 <BR>Email: super_investors_grievance@yahoo.com <BR>Website: http://www.supercropsafe.in

Read More

Has Super Crop Safe declared dividend?

06-Jun-2025

Yes, Super Crop Safe Ltd has declared a dividend of 5% (0.1 per share) with an ex-date of September 14, 2018. However, the dividend yield is currently 0%, and total returns have varied significantly over different periods, showing strong price appreciation in the long term.

Yes, Super Crop Safe Ltd has declared a dividend.<BR><BR>Dividend Details:<BR>- Percentage announced: 5%<BR>- Amount per share: 0.1<BR>- Ex-date: 14 Sep 18<BR><BR>Dividend Yield: 0%<BR><BR>Total Returns by Period:<BR>In the 6-month period, the price return was -25.66%, the dividend return was 0%, resulting in a total return of -25.66%.<BR><BR>In the 1-year period, the price return was 7.94%, the dividend return was 0%, resulting in a total return of 7.94%.<BR><BR>In the 2-year period, the price return was 95.82%, the dividend return was 0%, resulting in a total return of 95.82%.<BR><BR>In the 3-year period, the price return was 103.14%, the dividend return was 0%, resulting in a total return of 103.14%.<BR><BR>In the 4-year period, the price return was 66.75%, the dividend return was 0%, resulting in a total return of 66.75%.<BR><BR>In the 5-year period, the price return was 15.07%, the dividend return was 0%, resulting in a total return of 15.07%.<BR><BR>Overall, Super Crop Safe Ltd has declared a dividend, but the dividend yield is currently 0%. The total returns over various periods indicate significant price appreciation, particularly over the longer term, despite the absence of dividend income in recent years.

Read More

Who are the peers of the Super Crop Safe?

03-Jun-2025

Super Crop Safe's peers include P I Industries, UPL, Bayer CropSci., and others, with varying management risks and growth rates. Sharda Cropchem leads in 1-year returns at 102.06%, while Super Crop Safe has a return of 7.49%.

Peers: The peers of Super Crop Safe are P I Industries, UPL, Bayer CropSci., Sumitomo Chemi., Dhanuka Agritech, Sharda Cropchem, Bhaskar Agrochem, Adarsh Plant, and Phyto Chem (I).<BR><BR>Quality Snapshot: Excellent management risk is observed at Bayer CropSci., Dhanuka Agritech, and the rest. Good management risk is found at P I Industries, Sumitomo Chemi., Sharda Cropchem, and the rest. Average management risk is seen at UPL and Bhaskar Agrochem, while Below Average management risk is noted at Super Crop Safe, Adarsh Plant, and Phyto Chem (I). Growth is excellent at P I Industries, while Below Average growth is found at UPL, Bayer CropSci., Sumitomo Chemi., Dhanuka Agritech, Sharda Cropchem, Bhaskar Agrochem, and the rest. Super Crop Safe, Adarsh Plant, and Phyto Chem (I) also show Below Average growth. Capital Structure is excellent at P I Industries, Bayer CropSci., Sumitomo Chemi., Dhanuka Agritech, and Sharda Cropchem, while Below Average capital structure is noted at UPL, Super Crop Safe, Bhaskar Agrochem, Adarsh Plant, and Phyto Chem (I).<BR><BR>Return Snapshot: The peer with the highest 1-year return is Sharda Cropchem at 102.06%, while the lowest is Phyto Chem (I) at -9.22%. Super Crop Safe's 1-year return is 7.49%, which is higher than Phyto Chem (I) but lower than Sharda Cropchem. Additionally, peers with negative six-month returns include Super Crop Safe, Adarsh Plant, Phyto Chem (I), and UPL.

Read More

What is the technical trend for Super Crop Safe?

09-Jun-2025

As of April 7, 2025, Super Crop Safe has shifted to a strong bearish trend, confirmed by multiple indicators including the weekly MACD, Bollinger Bands, and daily moving averages.

As of 7 April 2025, the technical trend for Super Crop Safe has changed from mildly bearish to bearish. The current stance is bearish with a strong indication from multiple indicators. The weekly MACD is bearish, and the Bollinger Bands confirm a bearish trend on both weekly and monthly time frames. Daily moving averages also reflect a bearish sentiment. The KST is bearish on the weekly and mildly bearish on the monthly, while Dow Theory shows a mildly bearish trend on the weekly but no trend on the monthly. Overall, the combination of these indicators suggests a strong bearish outlook for the stock.

Read More

Who are the top shareholders of the Super Crop Safe?

17-Jul-2025

The top shareholders of Super Crop Safe are Bhogilal A Patel, the promoter with 10.68%, and Patel Pratik Vinodchandra, the highest public shareholder with 1.18%. Individual investors hold a combined 58.73%, with no reported holdings from mutual funds or foreign institutional investors.

The top shareholders of Super Crop Safe include Bhogilal A Patel, who is the promoter with the highest holding at 10.68%. The highest public shareholder is Patel Pratik Vinodchandra, holding 1.18%. Additionally, individual investors collectively hold a significant portion of shares, amounting to 58.73%. There are no holdings reported from mutual funds or foreign institutional investors.

Read More

Are Super Crop Safe latest results good or bad?

14-Aug-2025

The latest results for Super Crop Safe are concerning, with a 59.3% decline in Profit After Tax and a 6.96% drop in net sales year on year. While the Debtors Turnover Ratio has improved, the overall financial performance indicates significant challenges for the company.

The latest financial results for Super Crop Safe indicate a challenging situation for the company. The overall performance has declined, with a score dropping to -12 from -9 over the past three months. <BR><BR>Specifically, the Profit After Tax (PAT) has seen a significant decline of 59.3% year on year, amounting to Rs 0.50 crore. Additionally, net sales have decreased by 6.96% compared to the same quarter last year, reaching Rs 9.49 crore. This downward trend in both profitability and sales suggests that the company is facing considerable difficulties.<BR><BR>On a slightly positive note, the Debtors Turnover Ratio has improved to 2.95 times, the highest level in the last five half-yearly periods, indicating that Super Crop Safe is managing to settle its debts more efficiently. However, the overall financial performance reflects a negative outlook for the company in the near term.

Read More

Is Super Crop Safe overvalued or undervalued?

19-Aug-2025

As of August 18, 2025, Super Crop Safe is considered overvalued with a valuation grade of attractive, a PE ratio of 35.01, and has underperformed the Sensex with a return of -30.92% over the past year.

As of 18 August 2025, the valuation grade for Super Crop Safe has moved from very attractive to attractive, indicating a shift in perception regarding its investment potential. The company is currently considered overvalued. Key ratios include a PE ratio of 35.01, an EV to EBITDA of 26.44, and a ROE of 4.89%. <BR><BR>In comparison to peers, Super Crop Safe's PE ratio is slightly lower than P I Industries at 35.35, while UPL, also rated attractive, has a lower PE of 34.63. Notably, BASF India, which is classified as very expensive, has a significantly higher PE ratio of 48.31. Recent stock performance shows that Super Crop Safe has underperformed the Sensex over the past year, with a return of -30.92% compared to the Sensex's 1.04%, reinforcing the notion of overvaluation.

Read More

When is the next results date for Super Crop Safe?

11-Nov-2025

The next results date for Super Crop Safe is 14 November 2025.

The next results date for Super Crop Safe is scheduled for 14 November 2025.

Read More

How has been the historical performance of Super Crop Safe?

14-Nov-2025

Super Crop Safe's historical performance shows significant growth in net sales and profitability from March 2023 to March 2025, with net sales rising from INR 22.54 crore to INR 45.39 crore, despite increasing raw material costs. The company has improved its operating profit and profit after tax, indicating a recovery phase, although total liabilities and negative cash flow from operations remain concerns.

Answer:<BR>The historical performance of Super Crop Safe shows a fluctuating trend in net sales and profitability over the years. <BR><BR>Breakdown:<BR>Super Crop Safe's net sales increased significantly from INR 22.54 crore in March 2023 to INR 45.39 crore in March 2025, following a dip in the previous year. The total operating income mirrored this trend, rising from INR 22.54 crore in March 2023 to INR 45.39 crore in March 2025. However, the company faced challenges with raw material costs, which rose from INR 12.16 crore in March 2023 to INR 33.88 crore in March 2025. Despite these costs, the operating profit (PBDIT) improved from INR 3.26 crore in March 2023 to INR 4.37 crore in March 2025, indicating a recovery from previous losses. The profit before tax also showed a positive trend, moving from INR 0.96 crore in March 2023 to INR 2.05 crore in March 2025. Consequently, the profit after tax increased from INR 1.01 crore in March 2023 to INR 2.16 crore in March 2025. The company's total liabilities rose from INR 59.25 crore in March 2023 to INR 90.62 crore in March 2025, while total assets also increased from INR 59.25 crore to INR 90.62 crore during the same period. Cash flow from operating activities remained negative, but cash flow from financing activities showed a positive trend in March 2025. Overall, Super Crop Safe's financial performance reflects a recovery phase with increasing sales and profitability, despite rising costs and liabilities.

Read More

Should I buy, sell or hold Super Crop Safe?

16-Nov-2025

Why is Super Crop Safe falling/rising?

04-Dec-2025

As of 04-Dec, Super Crop Safe Ltd's stock price is at Rs 8.00, reflecting a 1.72% decline. The stock has significantly underperformed the Sensex, with a year-to-date drop of 62.79% and a bearish trend indicated by trading below all moving averages.

As of 04-Dec, Super Crop Safe Ltd's stock price is falling, currently at Rs 8.00, which reflects a decrease of Rs 0.14 or 1.72%. The stock has significantly underperformed compared to the benchmark Sensex, with a 1-week decline of 7.83% against a mere 0.53% drop in the Sensex. Over the past month, the stock has decreased by 23.37%, while the Sensex has gained 2.16%. Year-to-date, Super Crop Safe has plummeted by 62.79%, contrasting sharply with the Sensex's increase of 9.12%. <BR><BR>The stock is currently trading 4.38% above its 52-week low of Rs 7.65, indicating a precarious position. Additionally, it has underperformed its sector by 2.55% today and is trading below all its moving averages (5-day, 20-day, 50-day, 100-day, and 200-day), which suggests a bearish trend. Furthermore, there has been a notable decline in investor participation, with delivery volume dropping by 46.41% compared to the 5-day average. This combination of factors contributes to the stock's current downward trajectory.

Read More
iScoreScore
Click here to find our call on this stock
Strong Sell
Sell
Hold
Buy
Strong Buy

MarketsMojo — Loved in India, Now Global

The power of Mojo is now in 29 countries. Explore global equities with the same cutting-edge features you love.

Dashboard
1

Weak Long Term Fundamental Strength with an average Return on Capital Employed (ROCE) of 4.37%

  • Poor long term growth as Net Sales has grown by an annual rate of 1.01% over the last 5 years
  • Low ability to service debt as the company has a high Debt to EBITDA ratio of 7.03 times
2

Flat results in Sep 25

3

Reducing Promoter Confidence

4

Below par performance in long term as well as near term

stock-summaryMojo Parameters
Mojo Parameters
Loading Valuation Snapshot...
Stock DNA
stock-summary
Industry

Pesticides & Agrochemicals

stock-summary
Market cap

INR 33 Cr (Micro Cap)

stock-summary
P/E

20.00

stock-summary
Industry P/E

31

stock-summary
Dividend Yield

0.00%

stock-summary
Debt Equity

1.38

stock-summary
Return on Equity

5.25%

stock-summary
Price to Book

1.06

Revenue and Profits:
Net Sales:
15 Cr
(Quarterly Results - Sep 2025)
Net Profit:
1 Cr
stock-summaryTotal Returns
Total Returns (Price + Dividend) stock-summary
Dividend Yield (0%)
TimePeriod
Price Return
Dividend Return
Total Return
3 Months
-31.8%
0%
-31.8%
6 Months
-40.51%
0%
-40.51%
1 Year
-56.3%
0%
-56.3%
2 Years
-40.16%
0%
-40.16%
3 Years
24.43%
0%
24.43%
4 Years
16.93%
0%
16.93%
5 Years
-0.61%
0%
-0.61%

Latest dividend: 0.1 per share ex-dividend date: Sep-14-2018
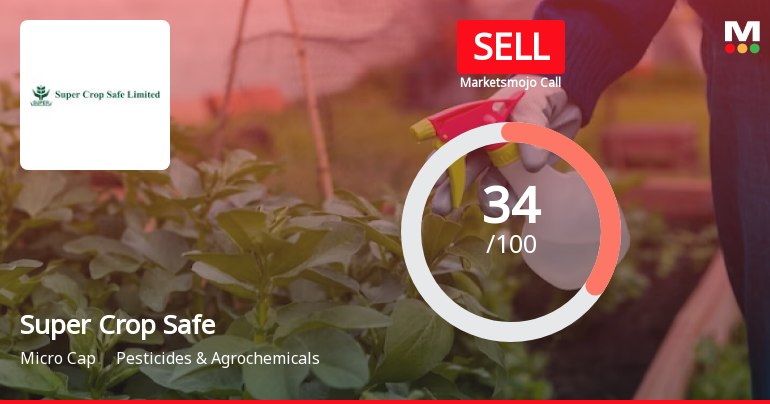
Risk Adjusted Returns v/s stock-summary
Returns Beta
Icon
Beta has not been calculated since enough price history is not available
stock-summaryNews & Corporate Actions
Announcements stock-summary

Board Meeting Outcome for Outcome Of The Board Meeting Of The Company Held On Today

14-Nov-2025 | Source : BSE

This is to inform you that 235th Meeting of the Board of Director of the Company was held on 14th November 2025 at the registered office of the Company C-1/ 290 GIDC Estate Phase- I Naroda Ahmedabad - 382330 at 1.00 p.m. to consider Un - Audited Financial Result of the Company for the Second Quarter ended on 30th September 2025 which was reviewed by the Audit Committee as well as Board and approved for submission to BSE and publication. Board Meeting concluded at 2.30 p.m.

Un - Audited Financial Result For The Second Quarter Ended As On 30Th September 2025

14-Nov-2025 | Source : BSE

As per Regulation 30 and Regulation 33 of the SEBI (Listing Obligation and Disclosure Requirement) Regulations 2015 Un-Audited Financial Result for the second quarter ended as on 30th September 2025 have been taken on record by the Board of Directors in their meeting held today.

Board Meeting Intimation for Board Meeting Of The Company To Consider Un-Audited Financial Result For The Second Quarter Ended On 30Th September 2025

10-Nov-2025 | Source : BSE

Super Crop Safe Ltdhas informed BSE that the meeting of the Board of Directors of the Company is scheduled on 14/11/2025 inter alia to consider and approve This is to inform you that 235th Meeting of the board of directors of the company will be held on Friday 14th November 2025 at the registered office of the Company at 1:00 p.m. to consider the following items; 1. To consider Un - Audited Financial Result for the Second Quarter Ended on 30th September 2025 as per Regulation 33 of the SEBI (Listing Obligation and Disclosure Requirement) Regulation 2015. 2. Any Other matter with the permission of the chair.

Corporate Actions stock-summary
stock-summary
BOARD MEETING

No Upcoming Board Meetings

stock-summary
DIVIDEND

Super Crop Safe Ltd has declared 5% dividend, ex-date: 14 Sep 18

stock-summary
SPLITS

No Splits history available

stock-summary
BONUS

No Bonus history available

stock-summary
RIGHTS

No Rights history available

stock-summaryKey Factors
Quality key factors stock-summary
Factor
Value
Sales Growth (5y)
1.01%
EBIT Growth (5y)
27.05%
EBIT to Interest (avg)
0
Debt to EBITDA (avg)
3.54
Net Debt to Equity (avg)
1.38
Sales to Capital Employed (avg)
0.65
Tax Ratio
Tax Ratio is Negative%
Dividend Payout Ratio
0
Pledged Shares
0
Institutional Holding
0.00%
ROCE (avg)
1.42%
ROE (avg)
4.39%
Valuation key factors
Factor
Value
P/E Ratio
20
Industry P/E
31
Price to Book Value
1.06
EV to EBIT
24.14
EV to EBITDA
20.76
EV to Capital Employed
1.02
EV to Sales
1.57
PEG Ratio
NA
Dividend Yield
NA
ROCE (Latest)
4.24%
ROE (Latest)
5.25%
Technicals key factors
Indicator
Weekly
Monthly
MACD
Bearish
Bearish
RSI
No Signal
No Signal
Bollinger Bands
Bearish
Bearish
Moving Averages
Bearish (Daily)
KST
Bearish
Bearish
Dow Theory
Mildly Bearish
Mildly Bearish
stock-summary Technical Indicator Scale: Bearish, Mildly Bearish, Sideways, Mildly Bullish, Bullish  Turned 
stock-summaryShareholding
Shareholding Snapshot : Sep 2025stock-summary
Shareholding Compare (%holding) stock-summary
Majority shareholders

Non Institution

Pledged Promoter Holdings

None

Mutual Funds

Held by 0 Schemes

FIIs

Held by 0 FIIs

Promoter with highest holding

Bhogilal A Patel (10.39%)

Highest Public shareholder

Patel Pratik Vinodchandra (1.18%)

Individual Investors Holdings

61.24%

stock-summaryFinancial
[
  {
    "link": "quarterly",
    "btn_text": "All Quarterly Results",
    "header": "Quarterly Results Snapshot (Standalone) - Sep'25 - YoY",
    "rhs": [
      {
        "prefix": "Net Sales ",
        "suffix": "YoY Growth in quarter ended Sep 2025 is 19.92% vs 90.81% in Sep 2024",
        "dir": -1
      },
      {
        "prefix": "Standalone Net Profit ",
        "suffix": "YoY Growth in quarter ended Sep 2025 is 29.82% vs 78.12% in Sep 2024",
        "dir": -1
      }
    ],
    "table": {
      "header": [
        "Sep'25",
        "Sep'24",
        "Change(%)"
      ],
      "body": [
        {
          "field": "Net Sales",
          "val1": "14.69",
          "val2": "12.25",
          "chgp": "19.92%",
          "chgp_class": "positive"
        },
        {
          "field": "Operating Profit (PBDIT) excl Other Income",
          "val1": "1.15",
          "val2": "1.09",
          "chgp": "5.50%",
          "chgp_class": "positive"
        },
        {
          "field": "Interest",
          "val1": "0.38",
          "val2": "0.46",
          "chgp": "-17.39%",
          "chgp_class": "positive"
        },
        {
          "field": "Exceptional Items",
          "val1": "0.00",
          "val2": "0.00",
          "chgp": "",
          "chgp_class": "neutral"
        },
        {
          "field": "Standalone Net Profit",
          "val1": "0.74",
          "val2": "0.57",
          "chgp": "29.82%",
          "chgp_class": "positive"
        },
        {
          "field": "Operating Profit Margin (Excl OI)",
          "val1": "7.83%",
          "val2": "8.90%",
          "chgp": "-1.07%",
          "chgp_class": "negative"
        }
      ]
    }
  },
  {
    "link": "half-yearly",
    "btn_text": "All Half Yearly Results",
    "header": "Half Yearly Results Snapshot (Standalone) - Sep'25",
    "rhs": [
      {
        "prefix": "Net Sales ",
        "suffix": " Growth in half year ended Sep 2025 is 7.80% vs 83.48% in Sep 2024",
        "dir": -1
      },
      {
        "prefix": "Standalone Net Profit ",
        "suffix": " Growth in half year ended Sep 2025 is -31.11% vs 260.00% in Sep 2024",
        "dir": -1
      }
    ],
    "table": {
      "header": [
        "Sep'25",
        "Sep'24",
        "Change(%)"
      ],
      "body": [
        {
          "field": "Net Sales",
          "val1": "24.19",
          "val2": "22.44",
          "chgp": "7.80%",
          "chgp_class": "positive"
        },
        {
          "field": "Operating Profit (PBDIT) excl Other Income",
          "val1": "2.12",
          "val2": "2.91",
          "chgp": "-27.15%",
          "chgp_class": "negative"
        },
        {
          "field": "Interest",
          "val1": "0.74",
          "val2": "0.92",
          "chgp": "-19.57%",
          "chgp_class": "positive"
        },
        {
          "field": "Exceptional Items",
          "val1": "0.00",
          "val2": "0.00",
          "chgp": "",
          "chgp_class": "neutral"
        },
        {
          "field": "Standalone Net Profit",
          "val1": "1.24",
          "val2": "1.80",
          "chgp": "-31.11%",
          "chgp_class": "negative"
        },
        {
          "field": "Operating Profit Margin (Excl OI)",
          "val1": "8.76%",
          "val2": "12.97%",
          "chgp": "-4.21%",
          "chgp_class": "negative"
        }
      ]
    }
  },
  {
    "link": "nine-monthly",
    "btn_text": "All Nine Monthly Results",
    "header": "Nine Monthly Results Snapshot (Standalone) - Dec'24",
    "rhs": [
      {
        "prefix": "Net Sales ",
        "suffix": "YoY Growth in nine months ended Dec 2024 is -1.07% vs 126.21% in Dec 2023",
        "dir": -1
      },
      {
        "prefix": "Standalone Net Profit ",
        "suffix": "YoY Growth in nine months ended Dec 2024 is 53.98% vs 826.32% in Dec 2023",
        "dir": -1
      }
    ],
    "table": {
      "header": [
        "Dec'24",
        "Dec'23",
        "Change(%)"
      ],
      "body": [
        {
          "field": "Net Sales",
          "val1": "35.00",
          "val2": "35.38",
          "chgp": "-1.07%",
          "chgp_class": "negative"
        },
        {
          "field": "Operating Profit (PBDIT) excl Other Income",
          "val1": "4.31",
          "val2": "4.98",
          "chgp": "-13.45%",
          "chgp_class": "negative"
        },
        {
          "field": "Interest",
          "val1": "1.36",
          "val2": "2.73",
          "chgp": "-50.18%",
          "chgp_class": "positive"
        },
        {
          "field": "Exceptional Items",
          "val1": "0.00",
          "val2": "0.00",
          "chgp": "",
          "chgp_class": "neutral"
        },
        {
          "field": "Standalone Net Profit",
          "val1": "2.71",
          "val2": "1.76",
          "chgp": "53.98%",
          "chgp_class": "positive"
        },
        {
          "field": "Operating Profit Margin (Excl OI)",
          "val1": "12.31%",
          "val2": "14.08%",
          "chgp": "-1.77%",
          "chgp_class": "negative"
        }
      ]
    }
  },
  {
    "link": "annual",
    "btn_text": "All Annual Results",
    "header": "Annual Results Snapshot (Standalone) - Mar'25",
    "rhs": [
      {
        "prefix": "Net Sales ",
        "suffix": "YoY Growth in year ended Mar 2025 is 45.25% vs 38.64% in Mar 2024",
        "dir": 1
      },
      {
        "prefix": "Standalone Net Profit ",
        "suffix": "YoY Growth in year ended Mar 2025 is 62.41% vs 31.68% in Mar 2024",
        "dir": 1
      }
    ],
    "table": {
      "header": [
        "Mar'25",
        "Mar'24",
        "Change(%)"
      ],
      "body": [
        {
          "field": "Net Sales",
          "val1": "45.39",
          "val2": "31.25",
          "chgp": "45.25%",
          "chgp_class": "positive"
        },
        {
          "field": "Operating Profit (PBDIT) excl Other Income",
          "val1": "4.33",
          "val2": "3.97",
          "chgp": "9.07%",
          "chgp_class": "positive"
        },
        {
          "field": "Interest",
          "val1": "1.82",
          "val2": "2.07",
          "chgp": "-12.08%",
          "chgp_class": "positive"
        },
        {
          "field": "Exceptional Items",
          "val1": "0.00",
          "val2": "0.00",
          "chgp": "",
          "chgp_class": "neutral"
        },
        {
          "field": "Standalone Net Profit",
          "val1": "2.16",
          "val2": "1.33",
          "chgp": "62.41%",
          "chgp_class": "positive"
        },
        {
          "field": "Operating Profit Margin (Excl OI)",
          "val1": "9.54%",
          "val2": "12.70%",
          "chgp": "-3.16%",
          "chgp_class": "negative"
        }
      ]
    }
  }
]
Quarterly Results Snapshot (Standalone) - Sep'25 - YoYstock-summary
Sep'25
Sep'24
Change(%)
Net Sales
14.69
12.25
19.92%
Operating Profit (PBDIT) excl Other Income
1.15
1.09
5.50%
Interest
0.38
0.46
-17.39%
Exceptional Items
0.00
0.00
Standalone Net Profit
0.74
0.57
29.82%
Operating Profit Margin (Excl OI)
7.83%
8.90%
-1.07%
Values in Rs Cr.
Direction Arrows
Net Sales

YoY Growth in quarter ended Sep 2025 is 19.92% vs 90.81% in Sep 2024

Direction Arrows
Standalone Net Profit

YoY Growth in quarter ended Sep 2025 is 29.82% vs 78.12% in Sep 2024

Half Yearly Results Snapshot (Standalone) - Sep'25stock-summary
Sep'25
Sep'24
Change(%)
Net Sales
24.19
22.44
7.80%
Operating Profit (PBDIT) excl Other Income
2.12
2.91
-27.15%
Interest
0.74
0.92
-19.57%
Exceptional Items
0.00
0.00
Standalone Net Profit
1.24
1.80
-31.11%
Operating Profit Margin (Excl OI)
8.76%
12.97%
-4.21%
Values in Rs Cr.
Direction Arrows
Net Sales

Growth in half year ended Sep 2025 is 7.80% vs 83.48% in Sep 2024

Direction Arrows
Standalone Net Profit

Growth in half year ended Sep 2025 is -31.11% vs 260.00% in Sep 2024

Nine Monthly Results Snapshot (Standalone) - Dec'24stock-summary
Dec'24
Dec'23
Change(%)
Net Sales
35.00
35.38
-1.07%
Operating Profit (PBDIT) excl Other Income
4.31
4.98
-13.45%
Interest
1.36
2.73
-50.18%
Exceptional Items
0.00
0.00
Standalone Net Profit
2.71
1.76
53.98%
Operating Profit Margin (Excl OI)
12.31%
14.08%
-1.77%
Values in Rs Cr.
Direction Arrows
Net Sales

YoY Growth in nine months ended Dec 2024 is -1.07% vs 126.21% in Dec 2023

Direction Arrows
Standalone Net Profit

YoY Growth in nine months ended Dec 2024 is 53.98% vs 826.32% in Dec 2023

Annual Results Snapshot (Standalone) - Mar'25stock-summary
Mar'25
Mar'24
Change(%)
Net Sales
45.39
31.25
45.25%
Operating Profit (PBDIT) excl Other Income
4.33
3.97
9.07%
Interest
1.82
2.07
-12.08%
Exceptional Items
0.00
0.00
Standalone Net Profit
2.16
1.33
62.41%
Operating Profit Margin (Excl OI)
9.54%
12.70%
-3.16%
Values in Rs Cr.
Direction Arrows
Net Sales

YoY Growth in year ended Mar 2025 is 45.25% vs 38.64% in Mar 2024

Direction Arrows
Standalone Net Profit

YoY Growth in year ended Mar 2025 is 62.41% vs 31.68% in Mar 2024

stock-summaryCompany CV
About Super Crop Safe Ltd stock-summary
stock-summary
Super Crop Safe Ltd
Micro Cap
Pesticides & Agrochemicals
Incorporated in 1987, Super Crop Safe Ltd situated in Ahmadabad, Gujarat has been manufacturing and supplying premium quality Insecticides and Fungicides. Promoted by Shri Ishwar Bhai B Patel, the Company owns a widespread area of 15000 Sq meters. Besides, it has testing facilities like HPLC, GLC, VV and Spectrometer. The Company is engaged in manufacturing and trading of Agro Chemicals, Biological Products and Pesticides Formulations.
Company Coordinates stock-summary
Company Details
C-1/290 GIDC Estate, Phase I Naroda Ahmedabad Gujarat : 382330
stock-summary
Tel: 91-079-22823907 / 9824169514
stock-summary
super_investors_grievance@yahoo.com
Registrar Details