
Compare Super Spinning with Similar Stocks
Dashboard
Weak Long Term Fundamental Strength with a -33.60% CAGR growth in Net Sales over the last 5 years
- Company's ability to service its debt is weak with a poor EBIT to Interest (avg) ratio of 0.39
- The company has reported losses. Due to this company has reported negative ROE
With ROCE of 5.1, it has a Very Expensive valuation with a 0.6 Enterprise value to Capital Employed
Below par performance in long term as well as near term
Stock DNA
Garments & Apparels
INR 28 Cr (Micro Cap)
NA (Loss Making)
52
0.00%
0.30
-0.73%
0.50
Total Returns (Price + Dividend) 
Latest dividend: 0.1500 per share ex-dividend date: Sep-08-2008
Risk Adjusted Returns v/s
Returns Beta

News
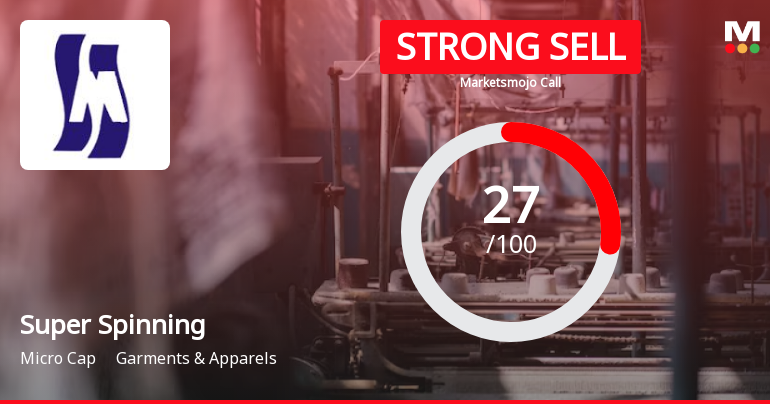
Super Spinning Mills Ltd is Rated Strong Sell
Super Spinning Mills Ltd is rated Strong Sell by MarketsMOJO. This rating was last updated on 02 July 2025. However, the analysis and financial metrics presented here reflect the stock's current position as of 09 July 2026, providing investors with an up-to-date view of the company’s fundamentals, valuation, financial trends, and technical outlook.
Read full news article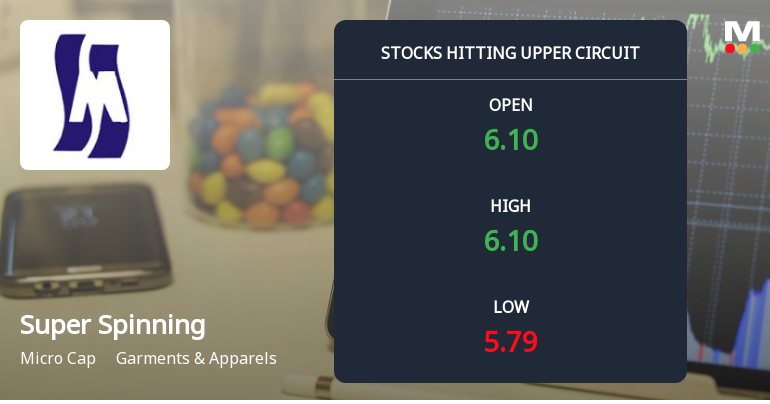
Super Spinning Mills Ltd Locks at Upper Circuit With 5% Gain — Buyers Queue, Sellers Absent
At Rs 6.31, the buying was done — not because demand dried up, but because the exchange wouldn't let the stock go any higher. Super Spinning Mills Ltd locked at its upper circuit of 5% on 1 Jul 2026, with buyers queuing and no sellers willing to part with shares.
Read full news article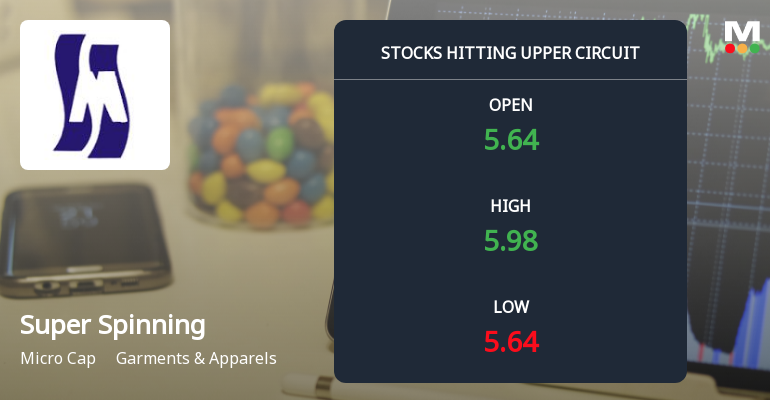
Super Spinning Mills Ltd Locks at Upper Circuit With 4.89% Gain — Buyers Queue, Sellers Absent
At Rs 6.01, the buying was done — not because demand dried up, but because the exchange wouldn't let the stock go any higher. Super Spinning Mills Ltd locked at its upper circuit of 4.89% on 30 Jun 2026, with buyers queuing and no sellers willing to part with shares.
Read full news article Announcements
Compliances-Certificate under Reg. 74 (5) of SEBI (DP) Regulations 2018
03-Jul-2026 | Source : BSECertificate under reg.74 (5) of SEBI (DP) Regulations 2018 for the quarter ended 30th June 2026
Disclosures under Reg. 29(2) of SEBI (SAST) Regulations 2011
27-Jun-2026 | Source : BSEThe Exchange has received the disclosure under Regulation 29(2) of SEBI (Substantial Acquisition of Shares & Takeovers) Regulations 2011 for Sumanth Ramamurthi
Closure of Trading Window
26-Jun-2026 | Source : BSEIntimation of closure of trading window from 1st July 2026 till 48 hours after the declaration of unaudited financial results for the quarter ended June 30 2026
Corporate Actions

No Upcoming Board Meetings

Super Spinning Mills Ltd has declared 15% dividend, ex-date: 08 Sep 08

Super Spinning Mills Ltd has announced 1:10 stock split, ex-date: 01 Sep 06

No Bonus history available

No Rights history available
Quality key factors
Valuation key factors
Technicals key factors
 Technical Indicator Scale: Bearish, Mildly Bearish, Sideways, Mildly Bullish, Bullish Turned
 Shareholding Snapshot : Mar 2026
Shareholding Compare (%holding)
Non Institution
None
Held by 1 Schemes (0.0%)
Held by 1 FIIs (0.0%)
Sumanth Ramamurthi (17.16%)
Super Spinning Mills Limited-unclaimed Suspense Account (1.62%)
48.8%
Quarterly Results Snapshot (Standalone) - Mar'26 - QoQ

QoQ Growth in quarter ended Mar 2026 is 3.80% vs -0.63% in Dec 2025

QoQ Growth in quarter ended Mar 2026 is -730.97% vs 334.62% in Dec 2025
Half Yearly Results Snapshot (Standalone) - Sep'25
Growth in half year ended Sep 2025 is -1.90% vs 9.76% in Sep 2024
Growth in half year ended Sep 2025 is 145.65% vs 94.16% in Sep 2024
Nine Monthly Results Snapshot (Standalone) - Dec'25
YoY Growth in nine months ended Dec 2025 is -1.27% vs 8.99% in Dec 2024
YoY Growth in nine months ended Dec 2025 is 482.86% vs 96.15% in Dec 2024
Annual Results Snapshot (Standalone) - Mar'26
YoY Growth in year ended Mar 2026 is -4.83% vs -4.60% in Mar 2025
YoY Growth in year ended Mar 2026 is 64.66% vs 21.45% in Mar 2025
About Super Spinning Mills Ltd

Company Coordinates


