
Compare Super Tannery with Similar Stocks
Dashboard
Weak Long Term Fundamental Strength with an average Return on Capital Employed (ROCE) of 6.80%
- Poor long term growth as Net Sales has grown by an annual rate of 5.26% and Operating profit at 5.67% over the last 5 years
- Low ability to service debt as the company has a high Debt to EBITDA ratio of 4.39 times
Flat results in Mar 26
51.12% of Promoter Shares are Pledged
Consistent Underperformance against the benchmark over the last 3 years
Stock DNA
Diversified consumer products
INR 79 Cr (Micro Cap)
11.00
38
0.70%
0.75
6.12%
0.70
Total Returns (Price + Dividend) 
Latest dividend: 0.05 per share ex-dividend date: Sep-17-2025
Risk Adjusted Returns v/s
Returns Beta

News
Super Tannery Ltd is Rated Strong Sell
Super Tannery Ltd is rated Strong Sell by MarketsMOJO, with this rating last updated on 01 June 2026. However, the analysis and financial metrics discussed here reflect the stock's current position as of 05 June 2026, providing investors with the most up-to-date view of the company’s performance and outlook.
Read full news article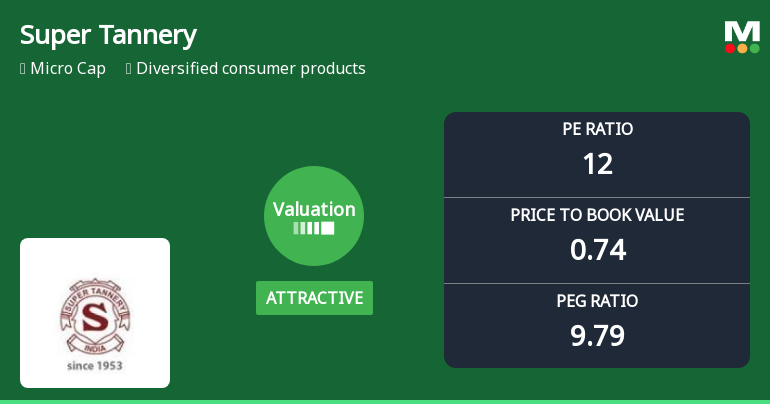
Super Tannery Ltd Valuation Shift Signals Renewed Price Attractiveness
Super Tannery Ltd, a micro-cap player in the diversified consumer products sector, has seen its valuation parameters improve from very attractive to attractive, despite a recent downgrade in its overall Mojo Grade to Strong Sell. This shift in price-to-earnings and price-to-book value ratios offers a nuanced perspective on the stock’s price attractiveness relative to its historical and peer benchmarks.
Read full news articleAre Super Tannery Ltd latest results good or bad?
Super Tannery Ltd's latest financial results for Q4 FY26 reveal a complex picture characterized by significant margin expansion amid ongoing revenue decline. The company reported net sales of ₹57.24 crores, reflecting a contraction of 4.39% compared to the previous quarter and a more pronounced decline of 17.04% year-over-year. This marks the seventh consecutive quarter of declining sales, indicating persistent challenges in demand for its core leather products, likely influenced by competitive pressures from synthetic alternatives and a weakening market in automotive and furniture sectors. In contrast, the net profit for the same quarter surged to ₹2.72 crores, representing a substantial increase of 138.60% quarter-over-quarter and 46.24% year-over-year. This notable profit growth was driven by improved operating margins, which rose to 11.93%, the highest in the past twelve months, suggesting effective co...
Read full news article Announcements
Announcement under Regulation 30 (LODR)-Newspaper Publication
01-Jun-2026 | Source : BSESuper Tannery Limited
Announcement under Regulation 30 (LODR)-Newspaper Publication
01-Jun-2026 | Source : BSESuper Tannery Limited
Audited Standalone And Consolidated Financial Result For The Year Ended 31.03.2026
31-May-2026 | Source : BSESuper Tannery Limited
Corporate Actions

No Upcoming Board Meetings

Super Tannery Ltd has declared 5% dividend, ex-date: 17 Sep 25

Super Tannery Ltd has announced 1:2 stock split, ex-date: 04 Nov 10

Super Tannery Ltd has announced 1:2 bonus issue, ex-date: 08 Feb 10

No Rights history available
Quality key factors
Valuation key factors
Technicals key factors
 Technical Indicator Scale: Bearish, Mildly Bearish, Sideways, Mildly Bullish, Bullish Turned
 Shareholding Snapshot : Mar 2026
Shareholding Compare (%holding)
Promoters
51.1249
Held by 0 Schemes
Held by 0 FIIs
Iftikharul Amin (14.11%)
Crb Capotal Markets Limited (2.55%)
33.81%
Quarterly Results Snapshot (Consolidated) - Mar'26 - QoQ

QoQ Growth in quarter ended Mar 2026 is -4.39% vs -3.67% in Dec 2025

QoQ Growth in quarter ended Mar 2026 is 138.60% vs 65.22% in Dec 2025
Half Yearly Results Snapshot (Consolidated) - Sep'25
Growth in half year ended Sep 2025 is -8.95% vs 30.91% in Sep 2024
Growth in half year ended Sep 2025 is -6.82% vs 12.00% in Sep 2024
Nine Monthly Results Snapshot (Consolidated) - Dec'25
YoY Growth in nine months ended Dec 2025 is -12.17% vs 30.52% in Dec 2024
YoY Growth in nine months ended Dec 2025 is -16.28% vs 30.16% in Dec 2024
Annual Results Snapshot (Consolidated) - Mar'26
YoY Growth in year ended Mar 2026 is -13.36% vs 24.62% in Mar 2025
YoY Growth in year ended Mar 2026 is 0.90% vs 14.02% in Mar 2025
About Super Tannery Ltd

Company Coordinates


