
Compare Superhouse Ltd with Similar Stocks
Dashboard
Weak Long Term Fundamental Strength with a -7.57% CAGR growth in Operating Profits over the last 5 years
- The company has been able to generate a Return on Equity (avg) of 3.99% signifying low profitability per unit of shareholders funds
Flat results in Mar 26
Consistent Underperformance against the benchmark over the last 3 years
Stock DNA
Diversified consumer products
INR 172 Cr (Micro Cap)
42.00
37
0.52%
0.23
0.85%
0.37
Total Returns (Price + Dividend) 
Latest dividend: 0.8 per share ex-dividend date: Sep-15-2025
Risk Adjusted Returns v/s
Returns Beta

News
Are Superhouse Ltd latest results good or bad?
Superhouse Ltd's latest financial results for Q4 FY26 reflect a complex operational landscape characterized by both challenges and some operational improvements. The company reported consolidated net sales of ₹154.95 crores, which represents a decline of 8.36% compared to the previous quarter and 11.98% year-on-year. This decline marks the lowest quarterly sales figure in the trailing twelve months, indicating a weakening demand in its core leather and textile export markets. Despite the revenue contraction, Superhouse achieved an operating margin of 8.45%, which is a notable improvement from 5.83% in the previous quarter. This suggests effective cost management, particularly as operating profit before depreciation, interest, tax, and other income (PBDIT excl OI) reached ₹12.70 crores, the highest level in recent quarters. However, this operational success was overshadowed by a consolidated net loss of ₹1....
Read full news article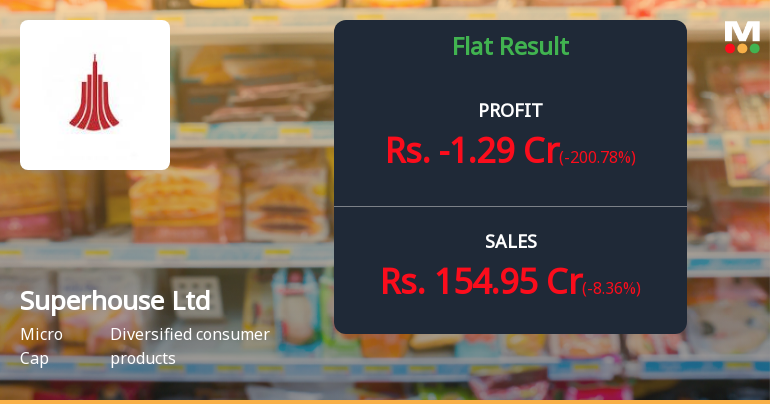
Superhouse Ltd Q4 FY26: Losses Deepen Amid Margin Pressures and Weak Demand
Superhouse Limited, the Kanpur-based diversified consumer products manufacturer specialising in leather, leather goods, and textiles, reported a consolidated net loss of ₹1.29 crores for Q4 FY26, marking a sharp deterioration from a profit of ₹1.28 crores in Q3 FY26. The company's stock tumbled 6.57% to ₹152.15 following the results announcement, reflecting investor disappointment with the continued earnings volatility.
Read full news article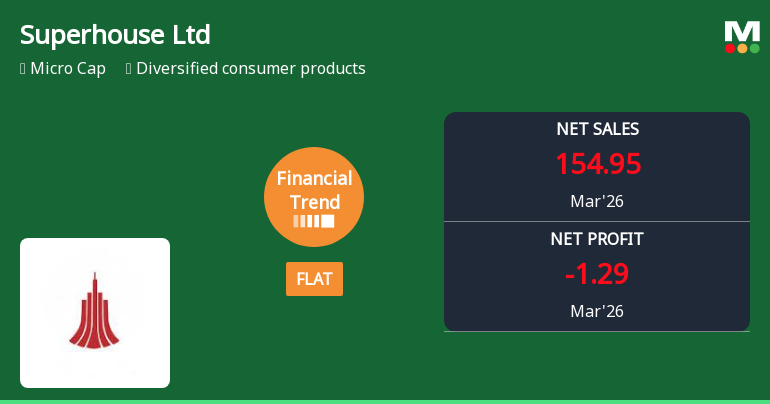
Superhouse Ltd Reports Flat Quarterly Performance Amid Margin Pressures
Superhouse Ltd, a micro-cap player in the diversified consumer products sector, has reported a flat financial performance for the quarter ended March 2026, signalling a notable shift from its previously positive growth trajectory. Despite some operational efficiencies, the company’s revenue and profitability metrics have shown signs of strain, prompting a downgrade in its Mojo Grade from Hold to Sell.
Read full news article Announcements
Announcement under Regulation 30 (LODR)-Credit Rating
08-Jun-2026 | Source : BSEPlease find enclosed our clarification regarding the delay in disclosure of the Credit Rating under Regulation 30 of the SEBI (Listing Obligations and Disclosure Requirements) Regulations 2015 in respect of the announcement submitted by the Company on 17th April 2024. We are also enclosing our reply and reaffirmation letter issued by Acuite Rating & Research Limited for your record.
Board Meeting Intimation for Approving Standalone And Consolidated Audited Financial Statements Of The Company For The Financial Year Ended 31St March 2026 And The Date Time And Venue Of The Ensuing Annual General Meeting Of The Company.
08-Jun-2026 | Source : BSESuperhouse Ltdhas informed BSE that the meeting of the Board of Directors of the Company is scheduled on 30/06/2026 inter alia to consider and approve The Standalone and Consolidated Audited Financial Statements of the company for the financial year ended 31st March 2026 together with the schedules annexures and notes forming part thereof and the date time and venue of the ensuing Annual General meeting of the company.
Corporate Action-Fixed Record Date For 15-09-2026
01-Jun-2026 | Source : BSECorporate Action- Fixed record date for 15-09-2026
Corporate Actions

30 Jun 2026

Superhouse Ltd has declared 8% dividend, ex-date: 15 Sep 25

No Splits history available

No Bonus history available

No Rights history available
Quality key factors
Valuation key factors
Technicals key factors
 Technical Indicator Scale: Bearish, Mildly Bearish, Sideways, Mildly Bullish, Bullish Turned
 Shareholding Snapshot : Mar 2026
Shareholding Compare (%holding)
Promoters
None
Held by 0 Schemes
Held by 1 FIIs (0.72%)
Mukhtarul Amin (12.01%)
Dheeraj Kumar Lohia (2.16%)
29.75%
Quarterly Results Snapshot (Consolidated) - Mar'26 - QoQ

QoQ Growth in quarter ended Mar 2026 is -8.36% vs -11.03% in Dec 2025

QoQ Growth in quarter ended Mar 2026 is -200.78% vs -69.88% in Dec 2025
Half Yearly Results Snapshot (Consolidated) - Sep'25
Growth in half year ended Sep 2025 is 8.51% vs -8.54% in Sep 2024
Growth in half year ended Sep 2025 is -51.83% vs 19.13% in Sep 2024
Nine Monthly Results Snapshot (Consolidated) - Dec'25
YoY Growth in nine months ended Dec 2025 is 6.72% vs -2.24% in Dec 2024
YoY Growth in nine months ended Dec 2025 is -39.17% vs -3.88% in Dec 2024
Annual Results Snapshot (Consolidated) - Mar'26
YoY Growth in year ended Mar 2026 is 1.77% vs -0.05% in Mar 2025
YoY Growth in year ended Mar 2026 is -54.06% vs -35.82% in Mar 2025
About Superhouse Ltd

Company Coordinates


