
Compare Supra Pacific with Similar Stocks
Stock DNA
Non Banking Financial Company (NBFC)
INR 155 Cr (Micro Cap)
20.00
24
0.42%
3.09
6.71%
1.33
Total Returns (Price + Dividend) 
Latest dividend: 0.2 per share ex-dividend date: Nov-21-2025
Risk Adjusted Returns v/s
Returns Beta

News

Supra Pacific Management Consultancy Ltd Downgraded to Sell Amid Mixed Fundamentals and Technicals
Supra Pacific Management Consultancy Ltd, a micro-cap player in the Non Banking Financial Company (NBFC) sector, has seen its investment rating downgraded from Hold to Sell as of 8 June 2026. This shift is primarily driven by a deterioration in technical indicators despite the company’s very attractive valuation and strong recent financial performance. The downgrade reflects a nuanced assessment across four key parameters: Quality, Valuation, Financial Trend, and Technicals.
Read full news article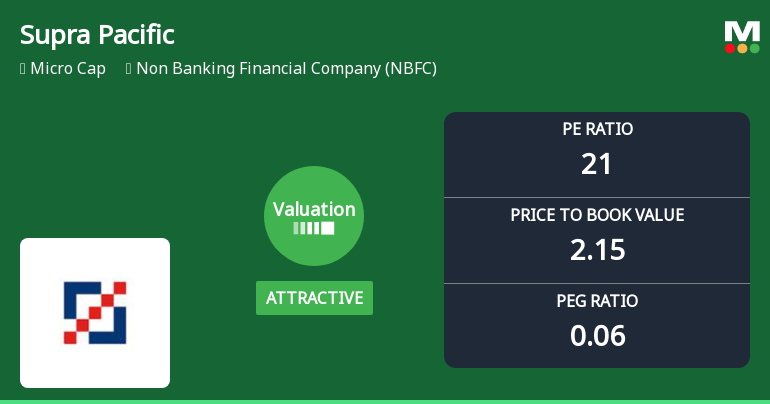
Supra Pacific Management Consultancy Ltd: Valuation Shift Enhances Price Attractiveness Amid NBFC Sector Dynamics
Supra Pacific Management Consultancy Ltd has witnessed a notable shift in its valuation parameters, moving from a very attractive to an attractive rating, signalling a change in price attractiveness that has caught the attention of investors. This micro-cap Non Banking Financial Company (NBFC) has demonstrated strong price momentum alongside improving financial metrics, prompting a reassessment of its market standing and investment potential.
Read full news article
Supra Pacific Management Consultancy Ltd is Rated Sell
Supra Pacific Management Consultancy Ltd is rated Sell by MarketsMOJO. This rating was last updated on 08 December 2025. However, the analysis and financial metrics discussed here reflect the stock's current position as of 01 June 2026, providing investors with the latest insights into the company’s performance and outlook.
Read full news article Announcements
Board Meeting Outcome for Outcome Of Board Meeting
06-Jun-2026 | Source : BSEThe outcome of the meeting of the Board of Directors held on Saturday on 6th June 2026. The meeting commenced at 10:30 a.m. and concluded at 12:30 p.m.
Board Meeting Outcome for Outcome Of Board Meeting
04-Jun-2026 | Source : BSEThe outcome of the meeting of the Board of Directors held on Thursday on 4th April 2026. The meeting commenced at 10:30 a.m. and concluded at 12.15 p.m.
Announcement under Regulation 30 (LODR)-Press Release / Media Release
03-Jun-2026 | Source : BSEPursuant to Reg 30 of SEBI (LODR) Regulations 2015 please find enclosed herewith the Press Release.
Corporate Actions

No Upcoming Board Meetings

Supra Pacific Management Consultancy Ltd has declared 2% dividend, ex-date: 21 Nov 25

No Splits history available

No Bonus history available

Supra Pacific Management Consultancy Ltd has announced 32:49 rights issue, ex-date: 12 Mar 26
Quality key factors
Valuation key factors
Technicals key factors
 Technical Indicator Scale: Bearish, Mildly Bearish, Sideways, Mildly Bullish, Bullish Turned
 Shareholding Snapshot : Mar 2026
Shareholding Compare (%holding)
Non Institution
None
Held by 0 Schemes
Held by 0 FIIs
Joby George (22.83%)
Centreal Consultancy Services Private Limited (12.26%)
49.97%
Quarterly Results Snapshot (Standalone) - Mar'26 - YoY

YoY Growth in quarter ended Mar 2026 is 59.25% vs 71.11% in Mar 2025

YoY Growth in quarter ended Mar 2026 is 288.89% vs 56.52% in Mar 2025
Half Yearly Results Snapshot (Standalone) - Sep'25
Growth in half year ended Sep 2025 is 92.78% vs 106.87% in Sep 2024
Growth in half year ended Sep 2025 is 708.11% vs 254.17% in Sep 2024
Nine Monthly Results Snapshot (Standalone) - Dec'25
YoY Growth in nine months ended Dec 2025 is 97.03% vs 89.61% in Dec 2024
YoY Growth in nine months ended Dec 2025 is 1,109.52% vs 100.00% in Dec 2024
Annual Results Snapshot (Standalone) - Mar'26
YoY Growth in year ended Mar 2026 is 85.28% vs 83.44% in Mar 2025
YoY Growth in year ended Mar 2026 is 591.23% vs 70.15% in Mar 2025
About Supra Pacific Management Consultancy Ltd

Company Coordinates


