
Compare Supreme Holdings with Similar Stocks
Dashboard
Poor Management Efficiency with a low ROE of 3.64%
- The company has been able to generate a Return on Equity (avg) of 3.64% signifying low profitability per unit of shareholders funds
Poor long term growth as Net Sales has grown by an annual rate of -39.04% and Operating profit at -225.47% over the last 5 years
Flat results in Mar 26
Risky - Negative EBITDA
Below par performance in long term as well as near term
Total Returns (Price + Dividend) 
Supreme Holdings for the last several years.
Risk Adjusted Returns v/s
Returns Beta

News

Supreme Holdings & Hospitality Ltd Upgraded to Sell on Technical Improvements Despite Weak Fundamentals
Supreme Holdings & Hospitality Ltd has seen its investment rating upgraded from Strong Sell to Sell, driven primarily by a shift in technical indicators despite persistent weaknesses in financial performance and valuation metrics. This nuanced change reflects a mild improvement in market sentiment, although fundamental challenges remain significant for investors to consider.
Read full news article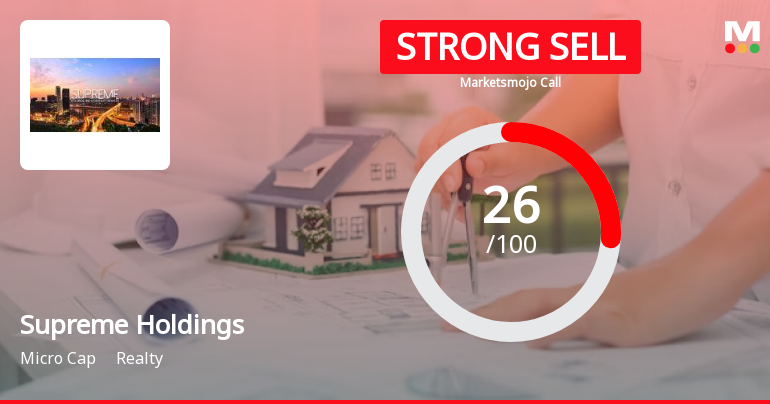
Supreme Holdings & Hospitality Ltd is Rated Strong Sell
Supreme Holdings & Hospitality Ltd is rated Strong Sell by MarketsMOJO, with this rating last updated on 01 June 2026. However, the analysis and financial metrics presented here reflect the company’s current position as of 14 June 2026, providing investors with the latest insights into its performance and outlook.
Read full news article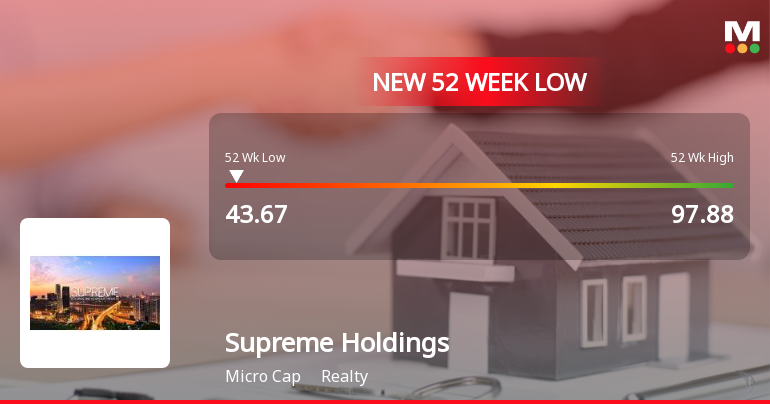
Supreme Holdings & Hospitality Ltd Falls to 52-Week Low of Rs 43.67 as Sell-Off Deepens
A sharp decline has pushed Supreme Holdings & Hospitality Ltd to a fresh 52-week low of Rs 43.67 on 11 Jun 2026, marking a significant 51.77% drop over the past year and underscoring persistent headwinds for this Realty micro-cap.
Read full news article Announcements
Corporate Actions

No Upcoming Board Meetings

No Dividend history available

No Splits history available

No Bonus history available

No Rights history available
Quality key factors
Valuation key factors
Technicals key factors
 Technical Indicator Scale: Bearish, Mildly Bearish, Sideways, Mildly Bullish, Bullish Turned
 Shareholding Snapshot : Mar 2026
Shareholding Compare (%holding)
Promoters
0.6672
Held by 0 Schemes
Held by 2 FIIs (0.39%)
Trinity Trust (21.87%)
Jumbo Bright Group Limited (23.3%)
13.23%
Quarterly Results Snapshot (Consolidated) - Mar'26 - YoY

YoY Growth in quarter ended Mar 2026 is 1,223.53% vs -99.15% in Mar 2025
YoY Growth in quarter ended Mar 2026 is 95.27% vs -206.96% in Mar 2025
Half Yearly Results Snapshot (Consolidated) - Sep'25

Growth in half year ended Sep 2025 is -99.44% vs 23.28% in Sep 2024
Growth in half year ended Sep 2025 is -95.68% vs 57.40% in Sep 2024
Nine Monthly Results Snapshot (Consolidated) - Dec'25
YoY Growth in nine months ended Dec 2025 is -97.64% vs 27.58% in Dec 2024
YoY Growth in nine months ended Dec 2025 is -96.06% vs 94.42% in Dec 2024
Annual Results Snapshot (Consolidated) - Mar'26
YoY Growth in year ended Mar 2026 is -94.25% vs -7.64% in Mar 2025
YoY Growth in year ended Mar 2026 is -96.29% vs 33.59% in Mar 2025
About Supreme Holdings & Hospitality Ltd

Company Coordinates


