
Compare Suraksha Diagno. with Similar Stocks
Stock DNA
Healthcare Services
INR 1,360 Cr (Micro Cap)
44.00
61
0.00%
0.42
13.15%
5.57
Total Returns (Price + Dividend) 
Suraksha Diagno. for the last several years.
Risk Adjusted Returns v/s
Returns Beta

News
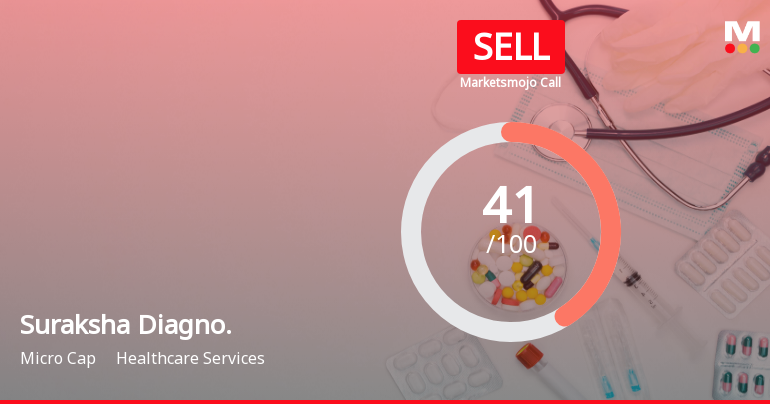
Suraksha Diagnostic Ltd is Rated Sell
Suraksha Diagnostic Ltd is rated Sell by MarketsMOJO, with this rating last updated on 01 June 2026. While the rating change occurred on that date, the analysis and financial metrics presented here reflect the stock’s current position as of 15 June 2026, providing investors with the most up-to-date view of the company’s fundamentals, returns, and market performance.
Read full news article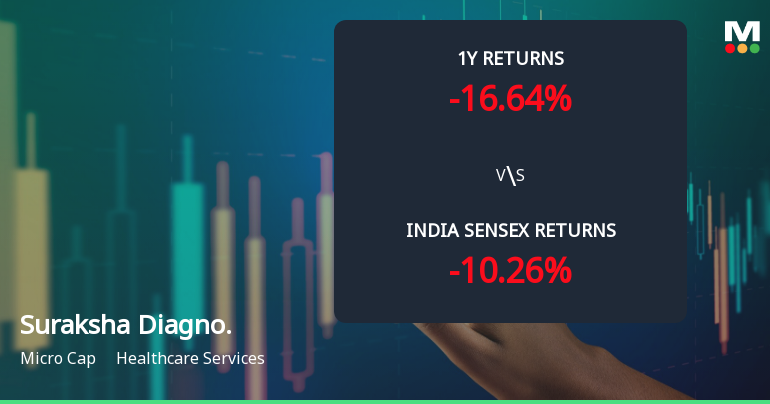
Suraksha Diagnostic Ltd Technical Momentum Shifts Amid Bearish Signals
Suraksha Diagnostic Ltd, a micro-cap player in the Healthcare Services sector, has experienced a subtle shift in price momentum, moving from a sideways trend to a mildly bearish stance. Despite some bullish weekly technical indicators, the overall technical landscape presents a complex picture, with key metrics such as moving averages and volume-based indicators signalling caution for investors.
Read full news article
Suraksha Diagnostic Ltd is Rated Sell
Suraksha Diagnostic Ltd is rated 'Sell' by MarketsMOJO, with this rating last updated on 01 June 2026. However, the analysis and financial metrics discussed here reflect the stock's current position as of 04 June 2026, providing investors with the most up-to-date view of the company’s performance and outlook.
Read full news article Announcements
Closure of Trading Window
15-Jun-2026 | Source : BSEPursuant to provisions of SEBI (Prohibition of Insider Trading) Regulations 2015 as amended from time to time we wish to inform you that in terms of the Companys Code of Conduct for regulating monitoring and reporting of trading by insiders the trading window for dealing in securities of the Company will remain closed for all designated persons and their immediate relatives from Wednesday 01 July 2026 and shall remain closed till 48 hours after the declaration of unaudited (standalone and consolidated) financial results of the Company for the quater ended 30 June 2026.
Announcement under Regulation 30 (LODR)-Resignation of Company Secretary / Compliance Officer
09-Jun-2026 | Source : BSEResignation of Ms. Mamta Jain Company Secretary & Compliance Officer and Key Managerial Personnel (KMP) of the Company.
Announcement under Regulation 30 (LODR)-Earnings Call Transcript
27-May-2026 | Source : BSETranscript of the Earning Call held on Friday 22 May 2026 with respect to the Audited (Standalone and Consolidated) Financial results of the Company for the quarter and year ended March 31 2026.
Corporate Actions

No Upcoming Board Meetings

No Dividend history available

No Splits history available

No Bonus history available

No Rights history available
Quality key factors
Valuation key factors
Technicals key factors
 Technical Indicator Scale: Bearish, Mildly Bearish, Sideways, Mildly Bullish, Bullish Turned
 Shareholding Snapshot : Mar 2026
Shareholding Compare (%holding)
Promoters
0.097
Held by 6 Schemes (19.79%)
Held by 4 FIIs (13.46%)
Ritu Mittal (15.93%)
Orbimed Asia Ii Mauritius Limited (12.88%)
12.08%
Quarterly Results Snapshot (Consolidated) - Mar'26 - QoQ

QoQ Growth in quarter ended Mar 2026 is 4.79% vs -1.32% in Dec 2025

QoQ Growth in quarter ended Mar 2026 is -16.49% vs -16.35% in Dec 2025
Half Yearly Results Snapshot (Consolidated) - Sep'25
Growth in half year ended Sep 2025 is 18.69% vs 14.14% in Sep 2024
Growth in half year ended Sep 2025 is 0.55% vs 46.83% in Sep 2024
Nine Monthly Results Snapshot (Consolidated) - Dec'25
YoY Growth in nine months ended Dec 2025 is 22.47% vs 14.36% in Dec 2024
YoY Growth in nine months ended Dec 2025 is 6.02% vs 42.87% in Dec 2024
Annual Results Snapshot (Consolidated) - Mar'26
YoY Growth in year ended Mar 2026 is 23.13% vs 15.26% in Mar 2025
YoY Growth in year ended Mar 2026 is 1.16% vs 34.66% in Mar 2025
About Suraksha Diagnostic Ltd

Company Coordinates


