
Compare Surana Solar with Similar Stocks
Dashboard
Weak Long Term Fundamental Strength with a -242.07% CAGR growth in Operating Profits over the last 5 years
- Company's ability to service its debt is weak with a poor EBIT to Interest (avg) ratio of -1.66
- The company has been able to generate a Return on Equity (avg) of 1.34% signifying low profitability per unit of shareholders funds
Flat results in Dec 25
Risky - Negative EBITDA
Below par performance in long term as well as near term
Stock DNA
Heavy Electrical Equipment
INR 119 Cr (Micro Cap)
372.00
30
0.00%
-0.12
0.58%
2.07
Total Returns (Price + Dividend) 
Latest dividend: 0.5 per share ex-dividend date: Sep-23-2015
Risk Adjusted Returns v/s
Returns Beta

News
Are Surana Solar Ltd latest results good or bad?
Surana Solar Ltd's latest financial results for Q1 FY26 indicate significant operational challenges. The company reported net sales of ₹2.09 crores, reflecting a quarter-on-quarter decline of 17.06%, which is a continuation of a downward trend in revenue. The operating profit before depreciation, interest, tax, and other income showed a loss of ₹1.80 crores, worsening from a loss of ₹1.10 crores in the previous quarter. This resulted in an operating margin of -86.12%, a substantial decline from -43.65% in Q4 FY25, highlighting the company's struggle to maintain profitability. Despite achieving a marginal consolidated net profit of ₹0.20 crores, this was primarily due to other income of ₹2.37 crores, which overshadowed the operational losses. The reliance on non-operating income raises concerns about the sustainability of profitability. The gross profit margin did show some improvement to 25.36% from -28.97...
Read full news article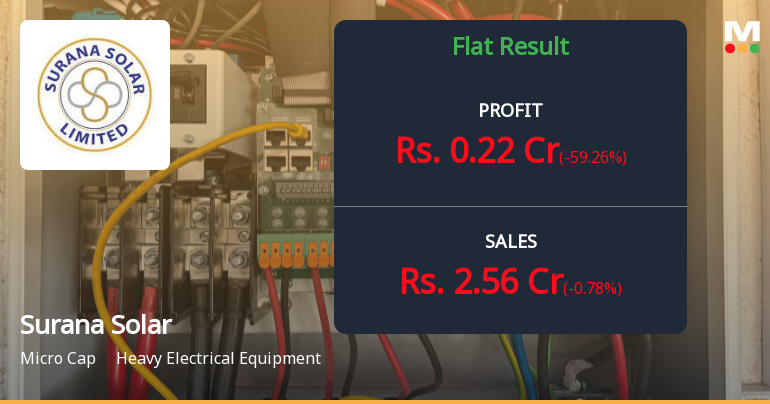
Surana Solar Q1 FY26: Mounting Losses and Weak Fundamentals Signal Deep Distress
Surana Solar Ltd. reported a consolidated net profit of ₹0.20 crores in Q1 FY26, marking a dramatic turnaround from a loss of ₹0.82 crores in Q4 FY25. However, this marginal profitability masks severe operational distress, with the company's core business posting an operating loss of ₹1.80 crores and operating margins collapsing to -86.12%. The stock, currently trading at ₹24.01 with a market capitalisation of ₹118.15 crores, has plunged 34.74% over the past year, significantly underperforming both the Sensex and its heavy electrical equipment sector peers.
Read full news article
Surana Solar Ltd is Rated Strong Sell
Surana Solar Ltd is rated Strong Sell by MarketsMOJO, with this rating last updated on 11 February 2025. However, the analysis and financial metrics discussed here reflect the company’s current position as of 29 January 2026, providing investors with an up-to-date view of the stock’s fundamentals, valuation, financial trend, and technical outlook.
Read full news article Announcements
Surana Solar Limited - Registrar & Share Transfer Agent Update
09-Dec-2019 | Source : NSESurana Solar Limited has informed the Exchange regarding the Registrar & Share Transfer Agent Update
Surana Solar Limited - Updates
27-Nov-2019 | Source : NSESurana Solar Limited has informed the Exchange regarding 'Newspaper advertisement confirming dispatch of Postal Ballot Notice'.
Shareholders meeting
22-Sep-2019 | Source : NSE
| Surana Solar Limited has submitted the Exchange a copy Srutinizers report of Annual General Meeting held on September 21, 2019. Further, the company has informed the Exchange regarding voting results. |
Corporate Actions

No Upcoming Board Meetings

Surana Solar Ltd has declared 10% dividend, ex-date: 23 Sep 15

Surana Solar Ltd has announced 5:10 stock split, ex-date: 25 Nov 14

No Bonus history available

No Rights history available
Quality key factors
Valuation key factors
Technicals key factors
 Technical Indicator Scale: Bearish, Mildly Bearish, Sideways, Mildly Bullish, Bullish Turned
 Shareholding Snapshot : Dec 2025
Shareholding Compare (%holding)
Non Institution
None
Held by 2 Schemes (0.03%)
Held by 1 FIIs (0.03%)
Surana Telecom And Power Limited (36.21%)
Investor Education And Protection Fund Authority M (2%)
50.0%
Quarterly Results Snapshot (Standalone) - Dec'25 - QoQ

QoQ Growth in quarter ended Dec 2025 is -0.78% vs 23.44% in Sep 2025
QoQ Growth in quarter ended Dec 2025 is -59.26% vs 92.86% in Sep 2025
Half Yearly Results Snapshot (Standalone) - Sep'25
Growth in half year ended Sep 2025 is -81.83% vs 173.64% in Sep 2024
Growth in half year ended Sep 2025 is 36.67% vs 149.59% in Sep 2024
Nine Monthly Results Snapshot (Standalone) - Dec'25
YoY Growth in nine months ended Dec 2025 is -80.10% vs 163.47% in Dec 2024
YoY Growth in nine months ended Dec 2025 is 35.06% vs 170.00% in Dec 2024
Annual Results Snapshot (Standalone) - Mar'25

YoY Growth in year ended Mar 2025 is 119.09% vs -58.01% in Mar 2024
YoY Growth in year ended Mar 2025 is 104.76% vs -155.26% in Mar 2024
About Surana Solar Ltd

Company Coordinates


