
Compare Surat Trade with Similar Stocks
Dashboard
Weak Long Term Fundamental Strength with a -51.07% CAGR growth in Operating Profits over the last 5 years
- Company's ability to service its debt is weak with a poor EBIT to Interest (avg) ratio of -4.96
- The company has been able to generate a Return on Capital Employed (avg) of 3.15% signifying low profitability per unit of total capital (equity and debt)
Flat results in Mar 26
Consistent Underperformance against the benchmark over the last 3 years
Stock DNA
Garments & Apparels
INR 99 Cr (Micro Cap)
9.00
23
0.00%
-0.31
4.86%
0.44
Total Returns (Price + Dividend) 
Surat Trade for the last several years.
Risk Adjusted Returns v/s
Returns Beta

News
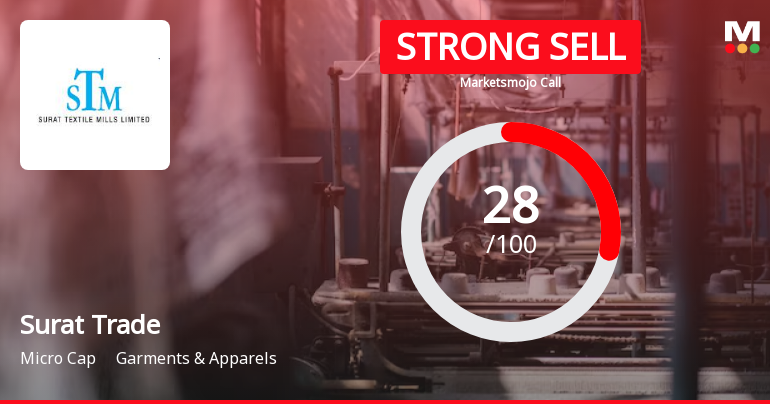
Surat Trade & Merchantile Ltd is Rated Strong Sell
Surat Trade & Merchantile Ltd is rated Strong Sell by MarketsMOJO, with this rating last updated on 14 Nov 2024. However, the analysis and financial metrics discussed here reflect the company’s current position as of 02 June 2026, providing investors with an up-to-date view of the stock’s fundamentals, valuation, financial trends, and technical outlook.
Read full news article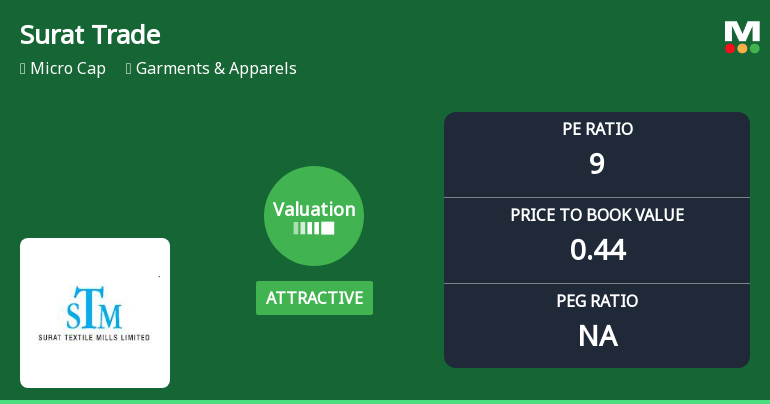
Surat Trade & Merchantile Ltd Valuation Shifts Signal Renewed Price Attractiveness
Surat Trade & Merchantile Ltd, a micro-cap player in the Garments & Apparels sector, has seen a notable shift in its valuation parameters, moving from a risky to an attractive valuation grade. This change is underscored by a significant decline in its price-to-earnings (P/E) and price-to-book value (P/BV) ratios compared to both its historical averages and peer group benchmarks, signalling a potential reappraisal of its price attractiveness despite ongoing operational challenges.
Read full news article
Surat Trade & Merchantile Ltd is Rated Strong Sell
Surat Trade & Merchantile Ltd is rated Strong Sell by MarketsMOJO, with this rating last updated on 14 Nov 2024. However, the analysis and financial metrics discussed here reflect the company’s current position as of 22 May 2026, providing investors with an up-to-date view of its fundamentals, returns, and overall market standing.
Read full news article Announcements
Announcement under Regulation 30 (LODR)-Newspaper Publication
27-May-2026 | Source : BSENewspaper Publication pertaining to Audited Financial Results for the Quarter and Year Ended March 31 2026
Appointment of Company Secretary and Compliance Officer
26-May-2026 | Source : BSEAppointment of Company Secretary and Compliance Officer
Board Meeting Outcome for Outcome Of The Board Meeting Held On 26Th May 2026
26-May-2026 | Source : BSEThis has reference to our letter dated 19th May 2026 with respect to the intimation for holding the Board meeting inter alia to consider and approve the financial results of the Company for the quarter and year ended 31st March 2026. Further with reference to the above this is to inform you that the Board of Directors of the Company at its Meeting held today i.e. on Tuesday 26th May 2026 inter alia transacted the businesses as attached in the letter.
Corporate Actions

No Upcoming Board Meetings

No Dividend history available

Surat Trade & Merchantile Ltd has announced 1:10 stock split, ex-date: 21 Feb 08

No Bonus history available

No Rights history available
Quality key factors
Valuation key factors
Technicals key factors
 Technical Indicator Scale: Bearish, Mildly Bearish, Sideways, Mildly Bullish, Bullish Turned
 Shareholding Snapshot : Mar 2026
Shareholding Compare (%holding)
Promoters
None
Held by 0 Schemes
Held by 0 FIIs
Alok Praful Shah (40.25%)
Garden Silk Mills Private (2.5%)
27.4%
Quarterly Results Snapshot (Standalone) - Mar'26 - QoQ

QoQ Growth in quarter ended Mar 2026 is 303.42% vs -31.61% in Dec 2025

QoQ Growth in quarter ended Mar 2026 is -117.53% vs 829.63% in Dec 2025
Half Yearly Results Snapshot (Standalone) - Sep'25
Growth in half year ended Sep 2025 is 14.91% vs 45.75% in Sep 2024
Growth in half year ended Sep 2025 is -7.67% vs 110.70% in Sep 2024
Nine Monthly Results Snapshot (Standalone) - Dec'25
YoY Growth in nine months ended Dec 2025 is 6.76% vs 31.23% in Dec 2024
YoY Growth in nine months ended Dec 2025 is -27.08% vs 118.72% in Dec 2024
Annual Results Snapshot (Standalone) - Mar'26
YoY Growth in year ended Mar 2026 is 62.22% vs 13.34% in Mar 2025
YoY Growth in year ended Mar 2026 is -5.83% vs 28.56% in Mar 2025
About Surat Trade & Merchantile Ltd

Company Coordinates


