
Compare Suratwwala Busi. with Similar Stocks
Dashboard
High Management Efficiency with a high ROCE of 36.67%
Company's ability to service its debt is strong with a healthy EBIT to Interest (avg) ratio of 27.84
Healthy long term growth as Net Sales has grown by an annual rate of 32.22%
With a growth in Net Sales of 40.64%, the company declared Outstanding results in Mar 26
With ROCE of 28.7, it has a Expensive valuation with a 2.9 Enterprise value to Capital Employed
Majority shareholders : Promoters
Below par performance in long term as well as near term
Total Returns (Price + Dividend) 
Latest dividend: 0.10000000000000002 per share ex-dividend date: Sep-12-2025
Risk Adjusted Returns v/s
Returns Beta

News

Suratwwala Business Group Ltd is Rated Hold
Suratwwala Business Group Ltd is rated 'Hold' by MarketsMOJO, with this rating last updated on 29 May 2026. While the rating change occurred on that date, the analysis and financial metrics discussed here reflect the company’s current position as of 12 June 2026, providing investors with the most up-to-date perspective on the stock’s fundamentals, returns, and overall outlook.
Read full news article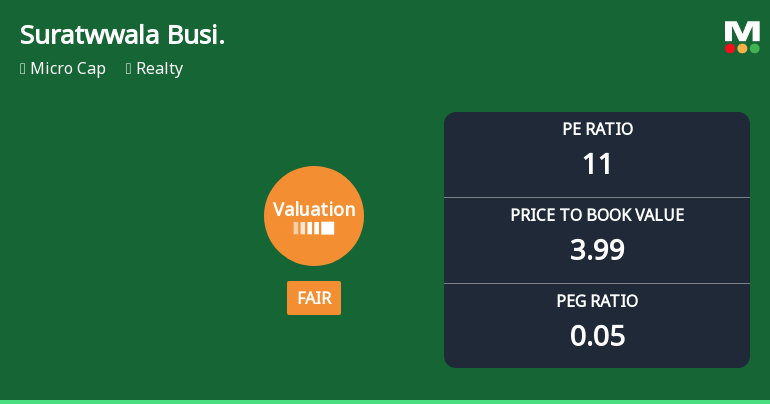
Suratwwala Business Group Ltd Valuation Shifts to Fair; P/E and P/BV Reflect Improved Price Attractiveness
Suratwwala Business Group Ltd has witnessed a notable shift in its valuation parameters, moving from an expensive to a fair pricing territory. This change comes amid a challenging market environment for the realty sector, with the stock’s price-to-earnings (P/E) and price-to-book value (P/BV) ratios now aligning more closely with historical averages and peer benchmarks. Investors are reassessing the company’s prospects as it balances strong return metrics against recent price declines and sector headwinds.
Read full news article
Suratwwala Business Group Ltd Upgraded to Hold by MarketsMOJO on Improved Fundamentals
Suratwwala Business Group Ltd, a micro-cap player in the realty sector, has seen its investment rating upgraded from Sell to Hold as of 29 May 2026. This change reflects notable improvements across key parameters including quality, valuation, financial trends, and technical indicators, signalling a more balanced outlook for investors despite recent market challenges.
Read full news article Announcements
Intimation About Participation At Samruddhi Season 3 Nav-Bharat Ka Caravan Organised By Hem Securities.
10-Jun-2026 | Source : BSEIntimation about participation at Samruddhi season 3 Nav-Bharat ka caravan organised by Hem Securities.
Announcement under Regulation 30 (LODR)-Newspaper Publication
29-May-2026 | Source : BSECopy of Newspaper Publications for Q4 and Year ended March 31 2026.
Board Meeting Intimation for To Consider And Approve Audited (Standalone And Consolidated) Financial Statements For The 4Th Quarter And Year Ended March 31 2026 And Other Business Matters.
15-May-2026 | Source : BSESuratwwala Business Group Ltdhas informed BSE that the meeting of the Board of Directors of the Company is scheduled on 27/05/2026 inter alia to consider and approve To consider and approve Audited (Standalone and Consolidated) Financial Statements for the 4th Quarter and Year Ended March 31 2026 and other business matters.
Corporate Actions

No Upcoming Board Meetings

Suratwwala Business Group Ltd has declared 10% dividend, ex-date: 12 Sep 25

Suratwwala Business Group Ltd has announced 1:10 stock split, ex-date: 18 Apr 24

No Bonus history available

No Rights history available
Quality key factors
Valuation key factors
Technicals key factors
 Technical Indicator Scale: Bearish, Mildly Bearish, Sideways, Mildly Bullish, Bullish Turned
 Shareholding Snapshot : Mar 2026
Shareholding Compare (%holding)
Promoters
None
Held by 0 Schemes
Held by 0 FIIs
Jatin Dhansukhlal Suratwala (38.7%)
Rajesh Bipin Kamdar (1.17%)
20.61%
Quarterly Results Snapshot (Consolidated) - Mar'26 - QoQ

QoQ Growth in quarter ended Mar 2026 is 40.64% vs 61.39% in Dec 2025
QoQ Growth in quarter ended Mar 2026 is 19.32% vs 36.40% in Dec 2025
Half Yearly Results Snapshot (Consolidated) - Sep'25

Growth in half year ended Sep 2025 is 281.88% vs -68.26% in Sep 2024
Growth in half year ended Sep 2025 is 212.27% vs -72.43% in Sep 2024
Nine Monthly Results Snapshot (Consolidated) - Dec'25
YoY Growth in nine months ended Dec 2025 is 492.23% vs -72.20% in Dec 2024
YoY Growth in nine months ended Dec 2025 is 445.90% vs -79.69% in Dec 2024
Annual Results Snapshot (Consolidated) - Mar'26
YoY Growth in year ended Mar 2026 is 298.52% vs -50.17% in Mar 2025
YoY Growth in year ended Mar 2026 is 243.30% vs -60.27% in Mar 2025
About Suratwwala Business Group Ltd

Company Coordinates


