
Compare SurgePays, Inc. with Similar Stocks
Dashboard
With a Operating Losses, the company has a Weak Long Term Fundamental Strength
- Low ability to service debt as the company has a high Debt to EBITDA ratio of -1.00 times
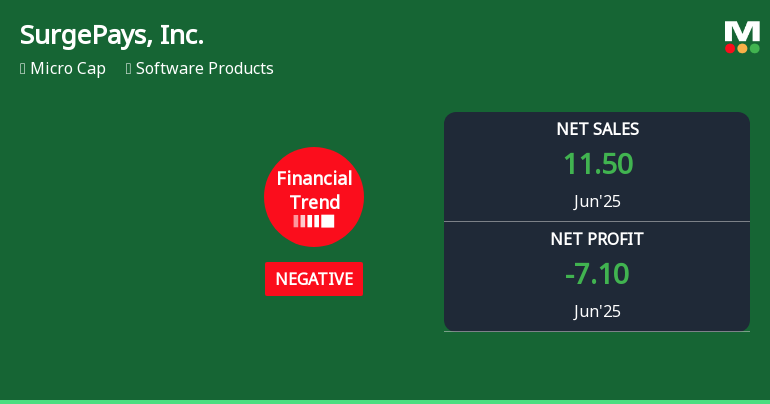
The company has declared Negative results for the last 5 consecutive quarters
Risky - Negative EBITDA
Underperformed the market in the last 1 year
Stock DNA
Software Products
USD 25 Million (Micro Cap)
NA (Loss Making)
NA
0.00%
-1.49
635.63%
-3.96
Total Returns (Price + Dividend) 
SurgePays, Inc. for the last several years.
Risk Adjusted Returns v/s
News
SurgePays, Inc. Experiences Revision in Its Stock Evaluation Amid Mixed Financial Metrics
SurgePays, Inc. reported its highest operating profit for the quarter ending June 2025, despite a significant decline in net sales and operating cash flow. The company faces challenges with a low return on capital employed and a high debt-equity ratio, while its stock has outperformed the S&P 500 over the past year.
Read full news article Announcements

Corporate Actions
Quality key factors
Valuation key factors
Technicals key factors
 Technical Indicator Scale: Bearish, Mildly Bearish, Sideways, Mildly Bullish, Bullish Turned
 Shareholding Snapshot : Sep 2025
Shareholding Compare (%holding)
Domestic Funds
Held in 9 Schemes (4.68%)
Held by 17 Foreign Institutions (1.47%)
Quarterly Results Snapshot (Consolidated) - Jun'25 - QoQ

QoQ Growth in quarter ended Jun 2025 is 8.49% vs 10.42% in Mar 2025
QoQ Growth in quarter ended Jun 2025 is 6.58% vs 62.00% in Mar 2025
Annual Results Snapshot (Consolidated) - Dec'24
YoY Growth in year ended Dec 2024 is -55.58% vs 12.84% in Dec 2023
YoY Growth in year ended Dec 2024 is -322.82% vs 3,533.33% in Dec 2023
About SurgePays, Inc.

Company Coordinates


