
Compare Sutlej Textiles with Similar Stocks
Dashboard
Weak Long Term Fundamental Strength with a -245.38% CAGR growth in Operating Profits over the last 5 years
- Low ability to service debt as the company has a high Debt to EBITDA ratio of 17.62 times
- The company has been able to generate a Return on Equity (avg) of 3.91% signifying low profitability per unit of shareholders funds
Flat results in Mar 26
Risky - Negative Operating Profits
Despite the size of the company, domestic mutual funds hold only 0% of the company
Consistent Underperformance against the benchmark over the last 3 years
Stock DNA
Garments & Apparels
INR 609 Cr (Micro Cap)
NA (Loss Making)
25
0.00%
1.12
-8.97%
0.76
Total Returns (Price + Dividend) 
Latest dividend: 0.9869960988296489 per share ex-dividend date: Aug-18-2023
Risk Adjusted Returns v/s
Returns Beta

News

Sutlej Textiles and Industries Ltd is Rated Sell
Sutlej Textiles and Industries Ltd is rated 'Sell' by MarketsMOJO, with this rating last updated on 27 May 2026. However, the analysis and financial metrics discussed here reflect the stock's current position as of 20 June 2026, providing investors with an up-to-date view of the company's fundamentals, returns, and market standing.
Read full news article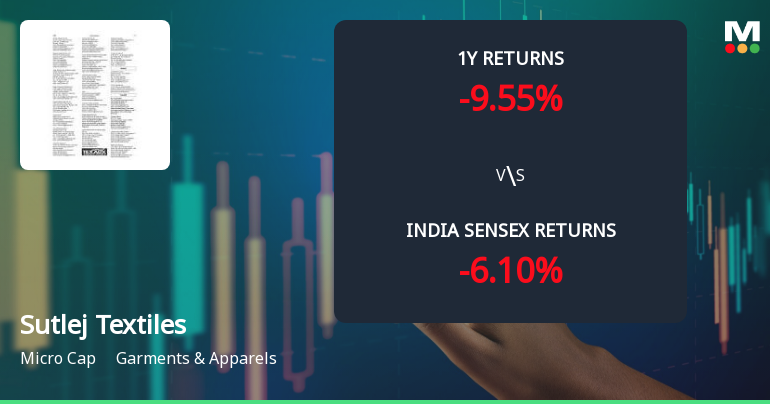
Sutlej Textiles and Industries Ltd: Technical Momentum Shifts Signal Bullish Outlook Amid Mixed Returns
Sutlej Textiles and Industries Ltd has experienced a notable shift in its technical momentum, moving from a mildly bullish stance to a more confident bullish trend. Despite a micro-cap status and a modest Mojo Score of 40.0 with a Sell grade, recent technical indicators suggest improving price dynamics, warranting close attention from investors navigating the Garments & Apparels sector.
Read full news article
Sutlej Textiles and Industries Ltd is Rated Sell
Sutlej Textiles and Industries Ltd is rated 'Sell' by MarketsMOJO, with this rating last updated on 27 May 2026. However, the analysis and financial metrics discussed here reflect the stock's current position as of 09 June 2026, providing investors with the most up-to-date view of the company’s fundamentals, returns, and market standing.
Read full news article Announcements
Announcement under Regulation 30 (LODR)-Newspaper Publication
29-May-2026 | Source : BSENewspaper Publication regarding opening of special window for transfer and dematerialization of physical securities.
Compliances-Reg.24(A)-Annual Secretarial Compliance
18-May-2026 | Source : BSESubmission of Annual Secretarial Compliance Report for the F.Y. 2025-26
Intimation Of Grant Of Stock Options Under The Sutlej Textiles And Industries Limited - Employee Stock Option Scheme 2026 (ESOP 2026)
14-May-2026 | Source : BSEGrant of Stock Options under ESOP 2026
Corporate Actions

No Upcoming Board Meetings

Sutlej Textiles and Industries Ltd has declared 100% dividend, ex-date: 18 Aug 23

Sutlej Textiles and Industries Ltd has announced 1:10 stock split, ex-date: 26 Sep 17

Sutlej Textiles and Industries Ltd has announced 1:2 bonus issue, ex-date: 27 Jun 13

No Rights history available
Quality key factors
Valuation key factors
Technicals key factors
 Technical Indicator Scale: Bearish, Mildly Bearish, Sideways, Mildly Bullish, Bullish Turned
 Shareholding Snapshot : Mar 2026
Shareholding Compare (%holding)
Promoters
None
Held by 0 Schemes
Held by 29 FIIs (1.05%)
Ganges Securities Limited (18.57%)
Birla Institute Of Technology And Science (6.89%)
16.12%
Quarterly Results Snapshot (Consolidated) - Mar'26 - QoQ

QoQ Growth in quarter ended Mar 2026 is 9.03% vs -0.91% in Dec 2025

QoQ Growth in quarter ended Mar 2026 is -12.43% vs 26.03% in Dec 2025
Half Yearly Results Snapshot (Consolidated) - Sep'25
Growth in half year ended Sep 2025 is -7.23% vs -6.65% in Sep 2024
Growth in half year ended Sep 2025 is -72.34% vs 62.28% in Sep 2024
Nine Monthly Results Snapshot (Consolidated) - Dec'25
YoY Growth in nine months ended Dec 2025 is -5.80% vs -2.38% in Dec 2024
YoY Growth in nine months ended Dec 2025 is -22.07% vs 49.27% in Dec 2024
Annual Results Snapshot (Consolidated) - Mar'26
YoY Growth in year ended Mar 2026 is -3.78% vs -0.98% in Mar 2025
YoY Growth in year ended Mar 2026 is -26.18% vs 49.54% in Mar 2025
About Sutlej Textiles and Industries Ltd

Company Coordinates


