
Compare Suven Life Scie. with Similar Stocks
Dashboard
With a Operating Losses, the company has a Weak Long Term Fundamental Strength
- Poor long term growth as Net Sales has grown by an annual rate of -11.98% and Operating profit at -207.58% over the last 5 years
- Company's ability to service its debt is weak with a poor EBIT to Interest (avg) ratio of -171.09
Flat results in Mar 26
Risky - Negative EBITDA
Stock DNA
Healthcare Services
INR 7,089 Cr (Small Cap)
NA (Loss Making)
34
0.00%
-0.85
-46.73%
11.59
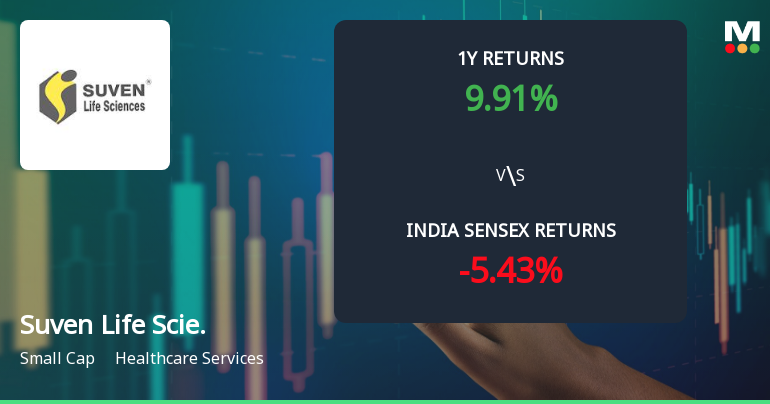
Total Returns (Price + Dividend) 
Latest dividend: 0.10500000000000001 per share ex-dividend date: Feb-14-2019
Risk Adjusted Returns v/s
Returns Beta

News
Suven Life Sciences Ltd Sees Technical Momentum Shift Amid Mixed Indicator Signals
Suven Life Sciences Ltd, a small-cap player in the Healthcare Services sector, has experienced a nuanced shift in its technical momentum, moving from a bullish to a mildly bullish stance. Despite a recent day decline of 2.92%, the stock’s longer-term technical indicators present a complex picture, with some signals improving while others suggest caution for investors.
Read full news article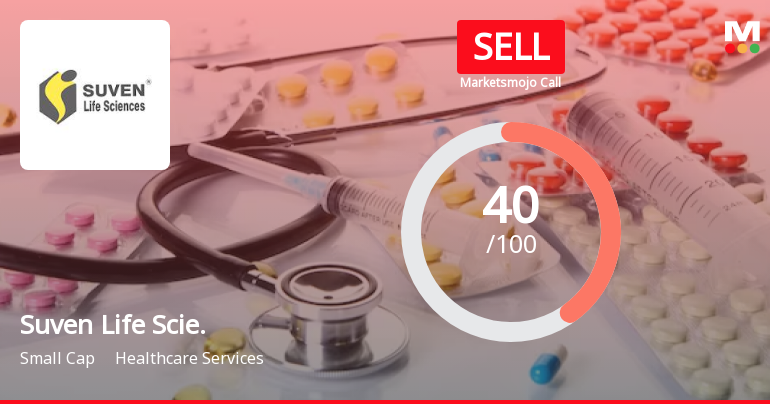
Suven Life Sciences Ltd is Rated Sell
Suven Life Sciences Ltd is rated 'Sell' by MarketsMOJO, with this rating last updated on 18 May 2026. However, the analysis and financial metrics discussed here reflect the stock's current position as of 10 June 2026, providing investors with an up-to-date view of the company’s fundamentals, returns, and market performance.
Read full news article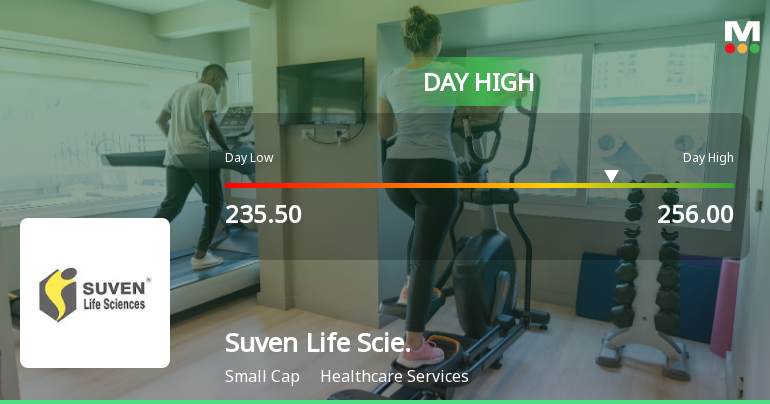
Suven Life Sciences Ltd Surges 7.2% to Day's High of Rs 256 — Outperforms Sector by 7.63 Percentage Points
The Sensex edged up 0.27% on 09 Jun 2026, but Suven Life Sciences Ltd outpaced the broader market with a robust 7.2% gain, touching an intraday high of Rs 256. This 7.63-percentage-point outperformance over its Healthcare Services sector peers signals a distinctly stock-specific rally rather than a market-wide lift.
Read full news article Announcements
Suven Life Sciences Limited - Updates
18-Nov-2019 | Source : NSESuven Life Sciences Limited has informed the Exchange regarding 'Newspaper advertisement regarding to Financial Results of the Company'.
Suven Life Sciences Limited - Investor Presentation
14-Nov-2019 | Source : NSESuven Life Sciences Limited has informed the Exchange regarding Investor Presentation
Suven Life Sciences Limited - Updates
08-Nov-2019 | Source : NSESuven Life Sciences Limited has informed the Exchange regarding 'Pursuant to Regulation 47 of the SEBI (Listing Obligations and Disclosure Requirements) Regulations, 2015 as amended, please find enclosed the copies of the newspaper advertisements pertaining to Notice of Company Petition in the matter of Composite Scheme of Arrangement as mentioned therein. The advertisements as appeared today i.e. November 07, 2019 in Business Standard and Nava Telangana (Telugu)'.
Corporate Actions

No Upcoming Board Meetings

Suven Life Sciences Ltd has declared 150% dividend, ex-date: 14 Feb 19

Suven Life Sciences Ltd has announced 1:2 stock split, ex-date: 23 Mar 07

Suven Life Sciences Ltd has announced 1:1 bonus issue, ex-date: 23 Mar 07

Suven Life Sciences Ltd has announced 1:2 rights issue, ex-date: 17 Oct 22
Quality key factors
Valuation key factors
Technicals key factors
 Technical Indicator Scale: Bearish, Mildly Bearish, Sideways, Mildly Bullish, Bullish Turned
 Shareholding Snapshot : Mar 2026
Shareholding Compare (%holding)
Promoters
None
Held by 4 Schemes (1.79%)
Held by 12 FIIs (0.91%)
Jasti Property And Equity Holdings Private Limited (in Its Capacity As Sole Trustee Of Jasti Family (69.57%)
Quant Mutual Fund - Quant Small Cap Fund (1.78%)
19.45%
Quarterly Results Snapshot (Consolidated) - Mar'26 - QoQ

QoQ Growth in quarter ended Mar 2026 is -45.91% vs 205.43% in Dec 2025

QoQ Growth in quarter ended Mar 2026 is 55.26% vs -31.83% in Dec 2025
Half Yearly Results Snapshot (Consolidated) - Sep'25
Growth in half year ended Sep 2025 is -22.07% vs -47.81% in Sep 2024
Growth in half year ended Sep 2025 is -65.85% vs -111.26% in Sep 2024
Nine Monthly Results Snapshot (Consolidated) - Dec'25
YoY Growth in nine months ended Dec 2025 is 7.90% vs -44.25% in Dec 2024
YoY Growth in nine months ended Dec 2025 is -97.56% vs -48.73% in Dec 2024
Annual Results Snapshot (Consolidated) - Mar'26
YoY Growth in year ended Mar 2026 is 6.76% vs -43.03% in Mar 2025
YoY Growth in year ended Mar 2026 is -71.91% vs -52.98% in Mar 2025
About Suven Life Sciences Ltd

Company Coordinates


