
Compare Swaraj Suiting with Similar Stocks
Dashboard
Healthy long term growth as Net Sales has grown by an annual rate of 57.30% and Operating profit at 72.32%
- NET SALES(Q) At Rs 207.25 cr has Grown at 51.3% (vs previous 4Q average)
- OPERATING PROFIT TO INTEREST(Q) Highest at 6.57 times
- PBT LESS OI(Q) At Rs 22.76 cr has Grown at 63.1% (vs previous 4Q average)
With ROCE of 14.3, it has a Attractive valuation with a 1.6 Enterprise value to Capital Employed
Despite the size of the company, domestic mutual funds hold only 0% of the company
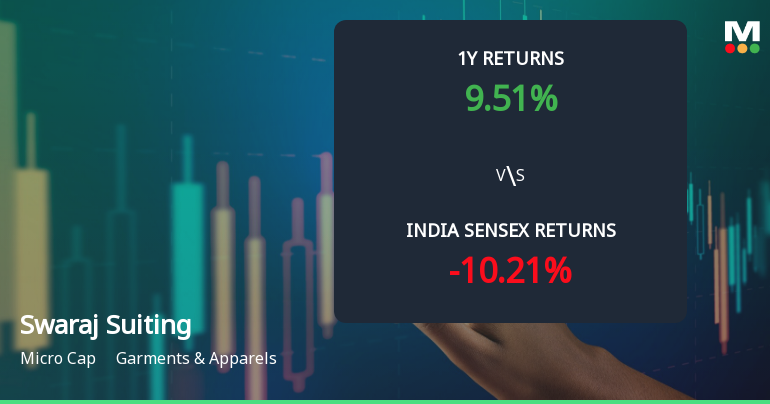
Below par performance in long term as well as near term
Stock DNA
Garments & Apparels
INR 674 Cr (Micro Cap)
11.00
23
0.00%
1.03
17.09%
2.14
Total Returns (Price + Dividend) 
Swaraj Suiting for the last several years.
Risk Adjusted Returns v/s
Returns Beta

News
Swaraj Suiting Ltd Technical Momentum Shifts Amid Mixed Market Signals
Swaraj Suiting Ltd has exhibited a notable shift in its technical momentum, moving from a mildly bearish stance to a more neutral sideways trend. Despite a 3.86% gain on 11 Jun 2026, the garment and apparel company’s technical indicators present a complex picture, with mixed signals across MACD, RSI, Bollinger Bands, and moving averages. This analysis delves into the evolving technical landscape and what it means for investors navigating this micro-cap stock.
Read full news article
Swaraj Suiting Ltd is Rated Sell
Swaraj Suiting Ltd is rated Sell by MarketsMOJO. This rating was last updated on 01 June 2026, reflecting a shift in the stock’s outlook. However, the analysis and financial metrics presented here are based on the company’s current position as of 09 June 2026, providing investors with the latest data to inform their decisions.
Read full news article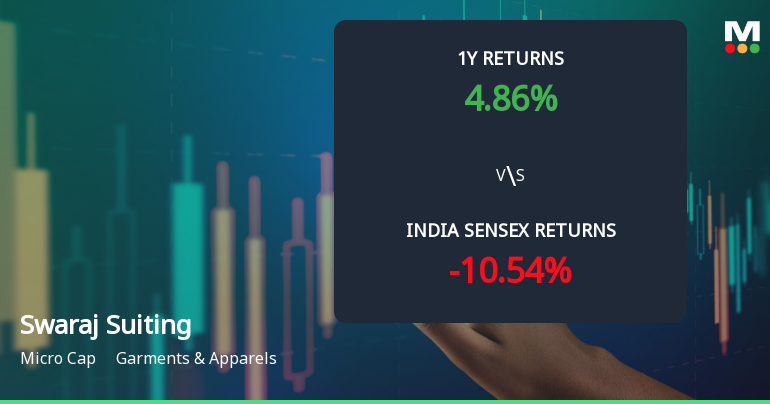
Swaraj Suiting Ltd Faces Mildly Bearish Technical Shift Amid Mixed Momentum
Swaraj Suiting Ltd, a micro-cap player in the Garments & Apparels sector, has experienced a notable shift in its technical momentum, moving from a sideways trend to a mildly bearish stance. Despite a recent downgrade from Hold to Sell by MarketsMOJO, the stock’s price action and technical indicators present a nuanced picture for investors navigating volatile market conditions.
Read full news article Announcements
Corporate Actions

No Upcoming Board Meetings

No Dividend history available

No Splits history available

Swaraj Suiting Ltd has announced 1:1 bonus issue, ex-date: 19 May 23

No Rights history available
Quality key factors
Valuation key factors
Technicals key factors
 Technical Indicator Scale: Bearish, Mildly Bearish, Sideways, Mildly Bullish, Bullish Turned
 Shareholding Snapshot : Mar 2026
Shareholding Compare (%holding)
Promoters
None
Held by 0 Schemes
Held by 2 FIIs (0.85%)
Divine Suiting Private Limited (20.53%)
None
26.75%
Quarterly Results Snapshot (Standalone) - Mar'26 - QoQ

QoQ Growth in quarter ended Mar 2026 is 25.36% vs 29.78% in Dec 2025

QoQ Growth in quarter ended Mar 2026 is 121.97% vs 23.40% in Dec 2025
Half Yearly Results Snapshot (Consolidated) - Sep'25
Growth in half year ended Sep 2025 is -19.95% vs 57.92% in Mar 2025
Growth in half year ended Sep 2025 is -23.66% vs 136.97% in Mar 2025
Nine Monthly Results Snapshot (Consolidated) - Dec'25
YoY Growth in nine months ended Dec 2025 is 0.20% vs 5.32% in Mar 2026
YoY Growth in nine months ended Dec 2025 is -16.22% vs 14.62% in Mar 2026
Annual Results Snapshot (Consolidated) - Mar'26
YoY Growth in year ended Mar 2026 is 38.45% vs 30.35% in Mar 2025
YoY Growth in year ended Mar 2026 is 60.33% vs 80.97% in Mar 2025
About Swaraj Suiting Ltd

Company Coordinates


