
Compare Switching Tech. with Similar Stocks
Dashboard
With a Negative Book Value, the company has a Weak Long Term Fundamental Strength
- Poor long term growth as Net Sales has grown by an annual rate of -5.42% and Operating profit at 0% over the last 5 years
- The company has a negative book value of Rs 5.88 crore
Negative results in Mar 26
Risky - Negative EBITDA
Stock DNA
Other Electrical Equipment
INR 30 Cr (Micro Cap)
NA (Loss Making)
54
0.00%
0.07
162.42%
-5.13
Total Returns (Price + Dividend) 
Switching Tech. for the last several years.
Risk Adjusted Returns v/s
Returns Beta

News

Switching Technologies Gunther Ltd is Rated Sell
Switching Technologies Gunther Ltd is rated 'Sell' by MarketsMOJO, with this rating last updated on 08 June 2026. However, the analysis and financial metrics presented here reflect the company’s current position as of 23 July 2026, providing investors with the latest insights into its performance and outlook.
Read full news article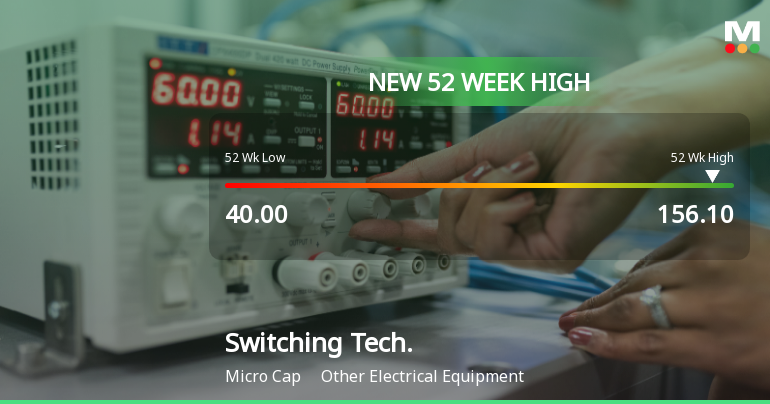
Broad-Based Technical Strength Lifts Switching Technologies Gunther Ltd to 52-Week High of Rs 156.1
Surging from a 52-week low of Rs 40 to a fresh high of Rs 156.1 on 10 Jul 2026, Switching Technologies Gunther Ltd has delivered an impressive 80.92% gain over the past year, significantly outperforming the Sensex which declined by 6.79% in the same period. This milestone caps a sustained rally fuelled by a confluence of bullish technical indicators and strong price momentum.
Read full news article
Announcements
Statement Of Deviation Or Variation For Proceeds Of Public Issue Rights Issue Preferential Issue QIP - Reg.
16-Jul-2026 | Source : BSEThe Company has not gone for any public issue rights issue preferential issue or the qualified institutional placement and therefore the submission of the statement of deviation or variation of the proceeds of the issue for the quarter ending 30th June 2026 with the Stock Exchange does not arise.
Compliances-Certificate under Reg. 74 (5) of SEBI (DP) Regulations 2018
13-Jul-2026 | Source : BSECertificate under Regulation 74(5) of the SEBI (Depositories and Participants) Regulations 2018 for the quarter ended 30th June 2026
Compliance With The SEBI Commercial Papers (CP) Circulars Read With Regulation 52(4)(D) Of SEBI (LODR) Regulations 2015
13-Jul-2026 | Source : BSEThe company during the quarter ended 30th June 2026 has not issued any Commercial Papers NCDs and NCRPs and therefore the due dates for repayment of principal alongwith the payments of interest/dividend does not arise.
Corporate Actions

No Upcoming Board Meetings

No Dividend history available

No Splits history available

No Bonus history available

No Rights history available
Quality key factors
Valuation key factors
Technicals key factors
 Technical Indicator Scale: Bearish, Mildly Bearish, Sideways, Mildly Bullish, Bullish Turned
 Shareholding Snapshot : Jun 2026
Shareholding Compare (%holding)
Promoters
None
Held by 0 Schemes
Held by 0 FIIs
Bbu Enterprises Private Limited (27.67%)
Omkar Mundhra (1.84%)
37.25%
Quarterly Results Snapshot (Standalone) - Mar'26 - QoQ

QoQ Growth in quarter ended Mar 2026 is 8.29% vs -13.06% in Dec 2025
QoQ Growth in quarter ended Mar 2026 is 672.99% vs -20.57% in Dec 2025
Half Yearly Results Snapshot (Standalone) - Sep'25
Growth in half year ended Sep 2025 is 10.16% vs -20.66% in Sep 2024

Growth in half year ended Sep 2025 is 3.39% vs 9.00% in Sep 2024
Nine Monthly Results Snapshot (Standalone) - Dec'25
YoY Growth in nine months ended Dec 2025 is 5.30% vs -13.08% in Dec 2024
YoY Growth in nine months ended Dec 2025 is -3.95% vs 26.11% in Dec 2024
Annual Results Snapshot (Standalone) - Mar'26
YoY Growth in year ended Mar 2026 is 6.87% vs -11.06% in Mar 2025
YoY Growth in year ended Mar 2026 is 197.91% vs -109.72% in Mar 2025
About Switching Technologies Gunther Ltd

Company Coordinates


