
Compare Sylph Industries with Similar Stocks
Dashboard
Weak Long Term Fundamental Strength with an average Return on Equity (ROE) of 2.64%
- Company's ability to service its debt is weak with a poor EBIT to Interest (avg) ratio of 0.33
Falling Participation by Institutional Investors
Consistent Underperformance against the benchmark over the last 3 years
Stock DNA
Computers - Software & Consulting
INR 38 Cr (Micro Cap)
5.00
20
0.00%
-0.01
6.11%
0.31
Total Returns (Price + Dividend) 
Sylph Industries for the last several years.
Risk Adjusted Returns v/s
Returns Beta

News
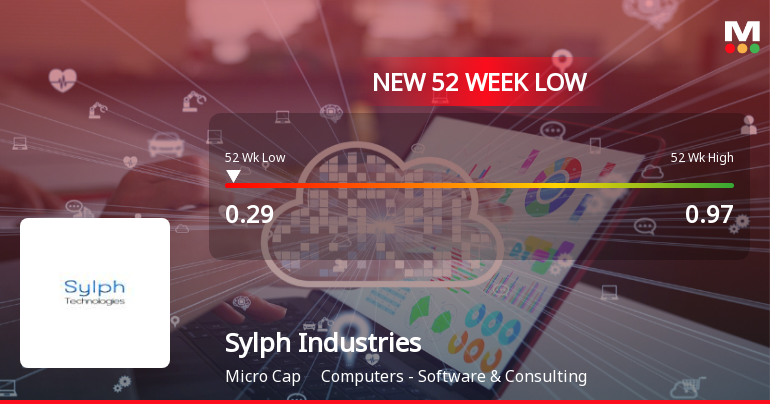
Sylph Industries Ltd Falls to 52-Week Low of Rs 0.29 as Sell-Off Deepens
For the second consecutive session, Sylph Industries Ltd has declined, culminating in a fresh 52-week low of Rs 0.29 on 4 Jun 2026. This latest drop extends the stock’s downward trajectory, which has now resulted in a near 50% loss over the past year, significantly underperforming the broader market benchmarks.
Read full news articleAre Sylph Industries Ltd latest results good or bad?
Sylph Industries Ltd has reported its financial results for Q4 FY26, showcasing significant volatility in its performance. The company achieved net sales of ₹24.87 crores, which reflects a substantial year-on-year increase from ₹0.18 crores in Q4 FY25, and a notable quarter-on-quarter growth from ₹15.57 crores in Q3 FY26. However, this growth narrative is complicated by a history of erratic revenue patterns, with previous quarters showing dramatic fluctuations, including a peak of ₹42.92 crores in Q2 FY26 followed by a decline in Q3 FY26. Net profit for the quarter stood at ₹1.56 crores, marking a year-on-year increase from ₹0.12 crores in Q4 FY25 and a sequential improvement from ₹1.26 crores in Q3 FY26. Despite this, the company's profitability metrics raise concerns, as the PAT margin decreased to 6.27% from 8.09% in the prior quarter, indicating potential cost pressures as revenue scales. The Return o...
Read full news article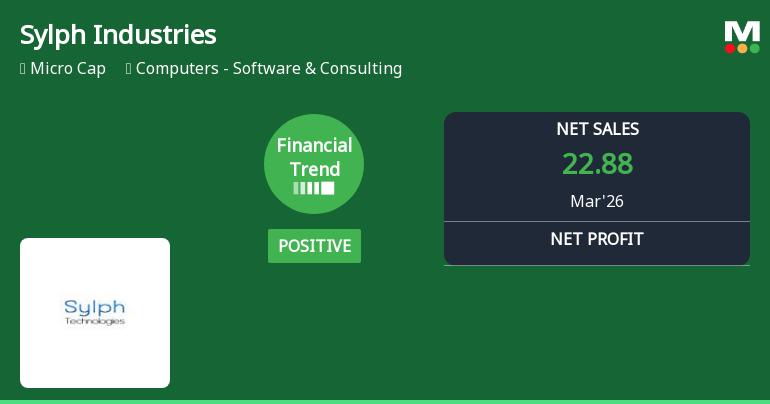
Sylph Industries Ltd Reports Positive Financial Trend Amidst Challenging Market Returns
Sylph Industries Ltd, a micro-cap player in the Computers - Software & Consulting sector, has reported a positive financial performance for the quarter ended March 2026, signalling a shift from its previously very positive trend to a more tempered but still favourable outlook. Despite ongoing market headwinds and a challenging broader index environment, the company’s recent results highlight robust revenue growth and improved profitability metrics, although its overall mojo grade has been downgraded to Sell from Hold as of 20 April 2026.
Read full news article Announcements
Announcement under Regulation 30 (LODR)-Newspaper Publication
04-Jun-2026 | Source : BSENewspaper publication in respect of Audited Standalone and Consolidated Financial Results for the Quarter/ Year Ended 31st March 2026.
Board Meeting Outcome for Outcome Of The Meeting Of The Board Of Directors Of Sylph Industries Limited Held On Today I.E. Tuesday 02Nd June 2026.
02-Jun-2026 | Source : BSEConduct Postal Ballot by means of E-voting for obtaining approval of the members of the Company for approving the Appointment of Mr. Hasmukh Nanalal Shah (DIN: 00398666) as Executive- Managing Director of the Company.
Shareholder Meeting / Postal Ballot-Notice of Postal Ballot
02-Jun-2026 | Source : BSENotice of Postal Ballot
Corporate Actions

No Upcoming Board Meetings

No Dividend history available

Sylph Industries Ltd has announced 1:10 stock split, ex-date: 02 Jun 23

Sylph Industries Ltd has announced 5:11 bonus issue, ex-date: 17 Dec 25

Sylph Industries Ltd has announced 15:11 rights issue, ex-date: 17 Apr 25
Quality key factors
Valuation key factors
Technicals key factors
 Technical Indicator Scale: Bearish, Mildly Bearish, Sideways, Mildly Bullish, Bullish Turned
 Shareholding Snapshot : Dec 2025
Shareholding Compare (%holding)
Non Institution
None
Held by 0 Schemes
Held by 3 FIIs (2.73%)
Mona Amarlal Kukreja (0.0%)
Kredence Multi Trading Limited (2.61%)
57.44%
Quarterly Results Snapshot (Standalone) - Mar'26 - QoQ

QoQ Growth in quarter ended Mar 2026 is 105.20% vs -71.23% in Dec 2025
QoQ Growth in quarter ended Mar 2026 is 2,362.50% vs -92.38% in Dec 2025
Half Yearly Results Snapshot (Consolidated) - Sep'25
Not Applicable: The company has declared_date for only one period
Not Applicable: The company has declared_date for only one period
Nine Monthly Results Snapshot (Standalone) - Dec'25
YoY Growth in nine months ended Dec 2025 is 8,143.69% vs -90.19% in Dec 2024
YoY Growth in nine months ended Dec 2025 is 371.54% vs -78.26% in Dec 2024
Annual Results Snapshot (Consolidated) - Mar'26
Not Applicable: The company has declared_date for only one period
Not Applicable: The company has declared_date for only one period
About Sylph Industries Ltd

Company Coordinates


